Hello,
Planning to update all the lessons that were published in the blog for the last 6 months. I'm doing a survey of my blog from the regular viewers who have found it useful. Can you take little bit of trouble and answer the following questions in the comments section. These questions are for the viewers or who wish to view this blog regularly.
1. How did you know about this blog?
2. How often do you view this blog?
3. Where do you study or work?
4. Why do you view this blog? Does it help you?
5. Which topics in this blog did you like the most?
6. What suggestions would you like to give to make this blog interesting and useful?
Thank you for your co-operation. I'm always at your service. If you need any clarification, please mail me - brhector21@rediffmail.com

Friday, June 26, 2009
Friday, June 19, 2009
A7 INTRODUCTION TO TOPOSHEETS-45D/7 AND 45D/10
PROFILE OF SURVEY MAP 45 D/7DESCRIPTION of the Area covered by Survey Sheet No. 45 D/7 (Gujarat and Rajasthan)
District : Banas Kantha and Sirohi
Location: Latitude 24 degree 15’ – 240 30’ North
Longitude 720 15’ - 720 30’ East
This region lies in western India on the borders of Rajasthan and Gujarat at the southern end of the Aravalli Hills, immediately north-east of Sheet 45 D/10.
RELIEF : The area is mainly a plain except for:
1. The east central region where the hills rise to almost 500 m.,
2. The lower hills of the north-east corner.
The slope of the land is from north-east to south-west in the northern half and east to west in the southern portion of the map. (indicated by flow of rivers)DRAINAGE1. The Banas river (not to be confused with the Banas river which is a tributary of the Chambal river to the north) flows into the swampland area of the Little Rann, north-east of the Gulf of Kutch. On this survey sheet it flows westward. It has two main right bank tributaries – Sarod and Arado Nadis and the numerous smaller streams like the one entering the river near Chekla (8192). The only left bank tributary is the Balaram Nadi from the south-east. The Banas river varies in width from 1/4km to over 1 km and has a narrow perennial water course. The dry portion fills in during the rainy seas.
2. The Sipu Nadi is a tributary of the Banas river (the confluence) lying to the west of the area shown. It flows from north-east to south-west withits two main tributaries –Varka and Mahadeviyao Nadis joining the left bank. Both rise in the hilly region to the east.
In the region there are numerous other streams that join main rivers. They rise in the higher ground adjacent to the rivers and invariably their courses show large tracts of broken ground indicating soft soil easily eroded by water.
SOILS: Map symbols indicate desert conditions, a large part of the plain area being sandy. Soils are soft as shown by excessive erosion causing broken ground near water courses.
CLIM ATE: There are three climatic seasons:
Summer hot and dry March to June
Monsoon hot and wet July to September
Winter cool and dry October to February
Maximum temperatures in summer are extremely high rising to over 470 C, while minimum temperatures in December/Jan often drops to almost 0 degree C. Because of its location in western India, it receives comparatively less rainfall than other parts of the country. The rainfall which is between 50 to 100 cm annually, falls during the monsoon season. High temperatures cause excessive evaporation. This gives rise to scrub and semi-desert vegetation.
NATURAL VEGETATION : Hill areas – dry deciduous forests of small trees
Plains – scrub and throny trees where there is no agriculture.
IRRIGATION: This region is dependent on the periodic rainfall (Monsoon), tanks, wells for
agriculture. There is only one canal in the north-east starting from the reservoir (2222)
OCCUPATIONS: Agriculture, rearing of cattle, sheep, camels and horses.
CROPS: Winter (Rabi) – Wheat, Barley, Cotton
Monsoons (Kharif) – Bajra, Jowar, Maize
COMMUNICATIONS: Except for the main line of the Western Railway and the road that runs across the south-east corner of the map through Chitrasani (8923), there are no other important communications. All other settlements are linked by cart tracks.
SETTLEMENTS: Except for Chitrasani which is a rail/road centre, all the settlements are small and widely scattered chiefly in the lowland area and are either nucleated or dispersed in pattern.
PROFILE OF SURVEY MAP 45 D/10
DESCRIPTION of the Area covered by Survey Sheet No. 45 D/10 (Gujarat and Rajasthan)
District : Banas Kantha and Sirohi
Location: Latitude 24 degree 30’ – 240 45’ North
Longitude 720 30’ - 720 45’ East
This region lies in western India on the borders of Rajasthan and Gujarat at the southern end of the Aravalli Hills, immediately north-east of Sheet 45 D/7.
RELIEF : The sheet is divided into two distinct physical divisions:
1. The Aravalli Hills rising to a height of over 1400 meters and occupying the south-east corner. The ranges are more or less parallel and run in a NE to SW directon.
2. A large plain covers the remaining portion of the sheet. There are frequent outcrops of rocky ground, some of it rising to over 400 m (i.e. 100 m above the surrounding country side.)
DRAINAGE: In the hill area, the drainage is radial. Abu being the highest point of the area is the centre from which the rivers radiate. In the plains, the upper courses of the rivers are dendritic or fan shaped. The main stream Sipu Nadi rises in the hills north of Abu and flows in a south-west direction. It is periodic and seldom exceeds ½ km in width.
TRIBUTARIES: Right bank : Sukli Nadi, Unda Wala, Dior Nadi,
Left bank: Sukli Nadi, unnamed river flowing past Dhavli, Devengan Nadi and Godua Nadi
NOTE:
1. There are three Sukli Nadis in the survey sheet.
2. Because this regions lies close to the desert areas where the soils tend to break up easily, the water courses are numerous and well defined for they are able to cut channels in the soft sandy soils. They are however periodic and rely on the rainy season for the water supply.
CLIM ATE: There are three climatic seasons:
Summer hot and dry March to June
Monsoon hot and wet July to September
Winter cool and dry October to February
Maximum temperatures in summer are extremely high rising to over 470 C, while minimum temperatures in December/Jan often drops to almost 0 degree C. Because of its location in western India, it receives comparatively less rainfall than other parts of the country. The rainfall which is between 50 to 100 cm annually, falls during the monsoon season. High temperatures cause excessive evaporation. This gives rise to scrub and semi-desert vegetation.
NATURAL VEGETATION : Hill areas – dry deciduous forests of small trees
Plains – scrub and throny trees where there is no agriculture.
IRRIGATION: This region is dependent on the periodic rainfall (Monsoon), tanks, wells for
agriculture. There is only one canal in the north-east starting from the reservoir (2222)
OCCUPATIONS: Agriculture, rearing of cattle, sheep, camels and horses.
CROPS: Winter (Rabi) – Wheat, Barley, Cotton
Monsoons (Kharif) – Bajra, Jowar, Maize
COMMUNICATIONS: Abu, in the hill area, is linked eastwards by two main roads, which run south-east to Abu Road and north-east to Oriya. In the south of this region the east-west main road links up at Karaunti (0700) with another main road which runs parallel to the foot-hills and connects a number of settlemtns. Many of the smaller settlements are linked by cart tracks.
SETTLEMENTS: Abu is a large hill resort, an administrative and an educational centre. In the plains, there are numerous settlements of much smaller size of which Sirori (2023) is the most important.
District : Banas Kantha and Sirohi
Location: Latitude 24 degree 15’ – 240 30’ North
Longitude 720 15’ - 720 30’ East
This region lies in western India on the borders of Rajasthan and Gujarat at the southern end of the Aravalli Hills, immediately north-east of Sheet 45 D/10.
RELIEF : The area is mainly a plain except for:
1. The east central region where the hills rise to almost 500 m.,
2. The lower hills of the north-east corner.
The slope of the land is from north-east to south-west in the northern half and east to west in the southern portion of the map. (indicated by flow of rivers)DRAINAGE1. The Banas river (not to be confused with the Banas river which is a tributary of the Chambal river to the north) flows into the swampland area of the Little Rann, north-east of the Gulf of Kutch. On this survey sheet it flows westward. It has two main right bank tributaries – Sarod and Arado Nadis and the numerous smaller streams like the one entering the river near Chekla (8192). The only left bank tributary is the Balaram Nadi from the south-east. The Banas river varies in width from 1/4km to over 1 km and has a narrow perennial water course. The dry portion fills in during the rainy seas.
2. The Sipu Nadi is a tributary of the Banas river (the confluence) lying to the west of the area shown. It flows from north-east to south-west withits two main tributaries –Varka and Mahadeviyao Nadis joining the left bank. Both rise in the hilly region to the east.
In the region there are numerous other streams that join main rivers. They rise in the higher ground adjacent to the rivers and invariably their courses show large tracts of broken ground indicating soft soil easily eroded by water.
SOILS: Map symbols indicate desert conditions, a large part of the plain area being sandy. Soils are soft as shown by excessive erosion causing broken ground near water courses.
CLIM ATE: There are three climatic seasons:
Summer hot and dry March to June
Monsoon hot and wet July to September
Winter cool and dry October to February
Maximum temperatures in summer are extremely high rising to over 470 C, while minimum temperatures in December/Jan often drops to almost 0 degree C. Because of its location in western India, it receives comparatively less rainfall than other parts of the country. The rainfall which is between 50 to 100 cm annually, falls during the monsoon season. High temperatures cause excessive evaporation. This gives rise to scrub and semi-desert vegetation.
NATURAL VEGETATION : Hill areas – dry deciduous forests of small trees
Plains – scrub and throny trees where there is no agriculture.
IRRIGATION: This region is dependent on the periodic rainfall (Monsoon), tanks, wells for
agriculture. There is only one canal in the north-east starting from the reservoir (2222)
OCCUPATIONS: Agriculture, rearing of cattle, sheep, camels and horses.
CROPS: Winter (Rabi) – Wheat, Barley, Cotton
Monsoons (Kharif) – Bajra, Jowar, Maize
COMMUNICATIONS: Except for the main line of the Western Railway and the road that runs across the south-east corner of the map through Chitrasani (8923), there are no other important communications. All other settlements are linked by cart tracks.
SETTLEMENTS: Except for Chitrasani which is a rail/road centre, all the settlements are small and widely scattered chiefly in the lowland area and are either nucleated or dispersed in pattern.
PROFILE OF SURVEY MAP 45 D/10
DESCRIPTION of the Area covered by Survey Sheet No. 45 D/10 (Gujarat and Rajasthan)
District : Banas Kantha and Sirohi
Location: Latitude 24 degree 30’ – 240 45’ North
Longitude 720 30’ - 720 45’ East
This region lies in western India on the borders of Rajasthan and Gujarat at the southern end of the Aravalli Hills, immediately north-east of Sheet 45 D/7.
RELIEF : The sheet is divided into two distinct physical divisions:
1. The Aravalli Hills rising to a height of over 1400 meters and occupying the south-east corner. The ranges are more or less parallel and run in a NE to SW directon.
2. A large plain covers the remaining portion of the sheet. There are frequent outcrops of rocky ground, some of it rising to over 400 m (i.e. 100 m above the surrounding country side.)
DRAINAGE: In the hill area, the drainage is radial. Abu being the highest point of the area is the centre from which the rivers radiate. In the plains, the upper courses of the rivers are dendritic or fan shaped. The main stream Sipu Nadi rises in the hills north of Abu and flows in a south-west direction. It is periodic and seldom exceeds ½ km in width.
TRIBUTARIES: Right bank : Sukli Nadi, Unda Wala, Dior Nadi,
Left bank: Sukli Nadi, unnamed river flowing past Dhavli, Devengan Nadi and Godua Nadi
NOTE:
1. There are three Sukli Nadis in the survey sheet.
2. Because this regions lies close to the desert areas where the soils tend to break up easily, the water courses are numerous and well defined for they are able to cut channels in the soft sandy soils. They are however periodic and rely on the rainy season for the water supply.
CLIM ATE: There are three climatic seasons:
Summer hot and dry March to June
Monsoon hot and wet July to September
Winter cool and dry October to February
Maximum temperatures in summer are extremely high rising to over 470 C, while minimum temperatures in December/Jan often drops to almost 0 degree C. Because of its location in western India, it receives comparatively less rainfall than other parts of the country. The rainfall which is between 50 to 100 cm annually, falls during the monsoon season. High temperatures cause excessive evaporation. This gives rise to scrub and semi-desert vegetation.
NATURAL VEGETATION : Hill areas – dry deciduous forests of small trees
Plains – scrub and throny trees where there is no agriculture.
IRRIGATION: This region is dependent on the periodic rainfall (Monsoon), tanks, wells for
agriculture. There is only one canal in the north-east starting from the reservoir (2222)
OCCUPATIONS: Agriculture, rearing of cattle, sheep, camels and horses.
CROPS: Winter (Rabi) – Wheat, Barley, Cotton
Monsoons (Kharif) – Bajra, Jowar, Maize
COMMUNICATIONS: Abu, in the hill area, is linked eastwards by two main roads, which run south-east to Abu Road and north-east to Oriya. In the south of this region the east-west main road links up at Karaunti (0700) with another main road which runs parallel to the foot-hills and connects a number of settlemtns. Many of the smaller settlements are linked by cart tracks.
SETTLEMENTS: Abu is a large hill resort, an administrative and an educational centre. In the plains, there are numerous settlements of much smaller size of which Sirori (2023) is the most important.
A3 TOPOGRAPHICAL SURVEY MAPS=part 1
A2
Fundamentals of Maps
THE SPHERICAL earth is best represented bya three-dimensional model of the earth, called a globe. All parts of the earth can be shown on it in their true shape, area and location along with correct cardinal directions and distances. But it cannot be made large enough to include detailed surface features. Hence, maps are much more useful tool than globes.
A map is a two-dimensional diagrammatic representation of the whole or part of the earth and its surface features both natural and cultural at a given scale on a flat surface. However, all that is shown on the map is not drawn to scale. Only distances and areas are drawn to scale. We are familiar with the maps of the earth surface. But it is possible to draw maps of other planets and even the sky when pertinent data becomes available to us. We already have crude maps of the Mars and the Moon. A map gives a picture of one or several of the elements of the earth’s surface and being creation of humans, it gives only those details, which its maker intends to give. Instead of showing the details in their true or visible shape and size, it uses symbols that may or may not have similarities with the shape and size of objects represented. Maps have unique advantage of showing objects or patterns that may be intangible or invisible.For example, it may show political boundaries or rainfall pattern or crop distribution, which may not be marked on the ground. Thus, maps are basically symbolic drawing of visible as well as conceived locational and distributional patterns of whole or a part of the earth, the sky or any other heavenly body.
There are various ways by which the earth can be mapped:
(a) by freehand sketches and diagrams;
(b) by actual survey with the help of instruments like chain and tape, plane table, prismatic compass and theodolite etc.;
(c) by photographs (ground photographs/aerial photographs);
(d) by satellite and radar charts.With the availability of high-speed computers and Global Positioning System(GPS), digital mapping has emerged as an important tool of mapping.
The amount of information given in a map depends on:
• Scale;
• Projection;
• Conventional signs and symbols;
• Skill of the cartographer;
• Method of map making; and
• Requirement of the user.
Types of Maps
Maps are of different types. Each map is unique in its design, content and construction and hence, a type by itself.
Maps are broadly classified on two bases: scale and purpose or content .
Based on the scale, there are two broad categories of maps:
i. Large Scale; and ii. Small Scale
i. Large Scale : These maps represent small area of the earth on a large size of paper/cloth/plastic sheet with greater details. Examples of some of the large scale maps are:
(i) Cadastral Maps: The term cadastral is derived from French word cadastre’ meaning register of territorial property.The Cadastral maps are drawn to register the ownership of landed property by demarcating the boundaries of fields, buildings, etc. They are especially prepared by governments to realise land revenue and property taxes. The village maps of our country may be cited as an example of large scale maps. These maps are drawn on a verylarge scale, varying from 16 cm to a km to 32 cm to a km so as to fill in all possible details. The city maps may also be included in this category.
(i) Cadastral Maps: The term cadastral is derived from French word cadastre’ meaning register of territorial property.The Cadastral maps are drawn to register the ownership of landed property by demarcating the boundaries of fields, buildings, etc. They are especially prepared by governments to realise land revenue and property taxes. The village maps of our country may be cited as an example of large scale maps. These maps are drawn on a verylarge scale, varying from 16 cm to a km to 32 cm to a km so as to fill in all possible details. The city maps may also be included in this category.
(ii) Topographical Maps: These maps are also prepared on a fairly large scale. They are based on precise surveys conducted by the Survey of India, Dehradun. They show general surface features in detail both natural and cultural. Principal topographic features depicted on these maps are relief, drainage, swamps and lakes, forests, villages, towns, means of transport and communication like roads and railways, and canals. Indian toposheets are generally prepared on the scale of 1:50,000.
Small Scale : These maps represent large areas on a small sheet of paper. They have fewer details. Examples of small scale maps are Atlas and Wall maps. The maps included in this book are also small scale maps. They give only a general picture of the area represented.
(i) Wall Maps: These maps are generally drawn boldly so that they can be seen from a distance. They are used in classrooms and cater to a larger audience. These maps broadly show very large areas like world as a whole, hemispheres, continents, and countries, states and districts. The scale is smaller than that of topographical maps but larger than atlas maps.
(ii) Chorographical or Atlas Maps: The Atlas maps are drawn on a very small scale and give a highly generalised picture of the natural and cultural aspects such as the physical, climatic and economic conditions of different regions of the earth. Only a few atlases are prepared on a 1:1,000,000 scale like the ‘Times Atlas of the World’. The Registrar General of India brings out Census Atlas from time to time. National Atlas and Thematic Mapping Organisation (NATMO) is a well-known important organisation in our country that publishes all kinds of maps for various purposes depicting different parts of the country. Thematic maps are usually prepared on small scale highlighting specific themes such as relief, temperature, and political divisions.
According to purpose or theme, maps could be broadly categorised as follow :
(a) Physical or Natural Maps:-
(i) Orographic or relief maps represent features like mountains, plains, plateaus, drainage patterns, etc.
(ii) Bathymetric maps show the depth of the oceans and seas. They are also known as charts.
(iii) Geological maps represent rocks that form the crust of the earth, and their mode of occurrence and disposition.
(iv) Climate maps show average condition of temperature, pressure wind andprecipitation of the world or part of it over a long period of time.
(v) Natural vegetation maps show natural flora of an area or region.
(vi) Soil map exhibits various types of soils covering the area.
(vii) Weather maps denote the average condition of temperature, pressure, wind and precipitation over a short period, which may range from a day to a season.
(viii) Astronomical maps show the position of stars and planets in the sky.
(b) Cultural Maps:-These maps show the man-made features or human aspects.
(i) Economic maps show distribution of important minerals, agricultural andindustrial products, and lines of transport and communication. They help inassessing economic development and potential of the area covered by the map.
(ii) Political maps show boundaries between different countries and states within countries.
(iii) Historical maps show the past events and facts.
(iv) Social maps depict elements like language, caste, ethnic groups and religion.
(v) Land utilisation maps exhibit the character of land use.
(c) Military Maps: Maps used by Defence Services are called Military maps.
(i) General maps on a scale of 1:1,000,000 or more depict only the broad topographical features. They are used by the Defence Services for general planning purposes.
(ii) Maps having scales ranging from 1:1,000,000 to 1:500,000 are oftenclassified as strategic maps. These maps are used for planning concentratedmilitary action.
(iii) Maps with a scale of 1:500,000 or less are called tactical maps. They serve as guides to small units like battalions and patrol units prior to and during movements anywhere near the front line.
(iv) Photomap is an air photograph with strategic and tactical data superimposed on it.All maps have some common elements. Location and distribution of various features and phenomena are depicted using distance, direction, and conventional signs and symbols.
SCALE
Scale is the relationship between the distance on a map and the real distance on the earth’s surface.
It may be expressed as a representative fraction (ratio), a line scale or a statement scale. It is an important element of a map because it gives relative picture of the ground reality. As you have read earlier, maps are generally classified into large scale and small scale. However, there is no universally accepted standard for classifying maps according to scale. What one considers to be large, may appear to be small or medium for others. The same person may consider a map to be of large scale for one purpose but of small scale for another purpose. As a result of this each specialised group of map users sets up its own standards for classification.As a matter of convention, maps having a scale 1:50,000 upto are classified as large scale maps, those falling between 1:50,000 and 1:1,000,000 as medium scale maps and those having scales above 1:1,000,000 are treated as small scale maps. The million sheets of the Survey of India and the National Atlas of India are considered to be medium scale maps.
Methods of Expressing Scales
The scales can be expressed in three ways:
1. Statement: The scale may be indicated in the form of a written statement. For example 1cm on the map represents 1 km on the ground. The scale is written as 1 cm to 1 km. This means that 1 cm on the map corresponds to 1 km on the ground. Although it is simple to express in words, it is difficult for those who are not familiar with the unit of measurement used. Besides, the scale will not be the same when the original map is reduced or enlarged. As such, this method is not very useful.
2. Representative Fraction (R.F.): It is also called as numerical scale. It is expressed as a ratio of map distance and ground distance. For example 1:1,000,000 means one unit of distance on the map corresponds to 1,000,000 units of distance on the ground. The advantage of R.F. is that it can be used universally irrespective of the local unit of measurement of distance. The mapcan be reduced or enlarged without changing the R.F.
3. Linear Scale or Graphical Scale: This scale is expressed as a horizontal or straight line. The base is calibrated to express visual equivalents of representative fraction or verbal scale. The bases are divided into a number of equal parts and are marked to show what these divisions represent on actual ground. The scale has the advantage that it remains true even after reduction or enlargement of the map. However, it is useful only to those who are familiar with the particular unit of measurement.
Distances on the map are smaller than the corresponding distances on actual ground. Scale is the means which enables us to reduce the whole or a part of the earth to a size which is not only convenient and handy but also logical and scientific. A general definition of scale is that it is a ratio between the distance on a map and the corresponding distance on the earth. For example if two points located 10 km apart are shown 1 cm apart on a map, then the scale of the map would be 1 cm to 10 km. It may also be converted into R.F as given below.Suppose, 1 cm = 10 KM.
Distances on the map are smaller than the corresponding distances on actual ground. Scale is the means which enables us to reduce the whole or a part of the earth to a size which is not only convenient and handy but also logical and scientific. A general definition of scale is that it is a ratio between the distance on a map and the corresponding distance on the earth. For example if two points located 10 km apart are shown 1 cm apart on a map, then the scale of the map would be 1 cm to 10 km. It may also be converted into R.F as given below.Suppose, 1 cm = 10 KM.
MAP DISTANCE
_______________
GROUND DISTANCE
=
1 cm
_____
10 km
=
1 cm
____________
10 X 10,000 cm
= 1: 1,000,000
(Note: 1 km has 100,000 cm.)
Methods of Measuring Linear Distance
Linear distance on maps are of two types:
(i) Straight lines like roads, railway line, and canals;
(ii) Curved or Zigzag lines, showing streams, coastline etc.
(a) When the line is straight, the distance can be measured with the help of a divider.Open a pair of dividers and place one of its legs at one end of the straight distance and the other leg on the other end on the map. Then lift the divider and place it on the calibrated bar scale to get the distance on the ground.
(b) When the route is zigzag, place one end of a thread at the starting point and carry the thread along the line. After completing the distance stretch the thread and measure the length. It will give approximate distance.It can also be measured with the help of a plain divider, as explained earlier, but the measurement will be less accurate. It can also be done with the help of a strip of paper.
(c) Rotameter is an instrument having a route measuring wheel. Distance between two points is measured by allowing the wheel of the rotameter to move along the route.
(c) Rotameter is an instrument having a route measuring wheel. Distance between two points is measured by allowing the wheel of the rotameter to move along the route.
Direction
Direction has been defined as an imaginary straight line on the map or the ground showing the angular position of various maps with respect to a common base direction. The line pointing to the north is regarded as the zero direction or base direction line.A map must have the base directions represented on it to enable the user to locate different features with respect to each other. North, south, east and west are the four major directions. These are also called cardinal points. In between cardinal points one may have several intermediate directions.A rough estimation of direction of the true north can be obtained by the Means of an ordinary watch. In the northern hemisphere if the watch is held in the horizontal position and turned until its hour hand points to the sun, the line that bisects the angle made by the hour hand with the line joining 12’O clock through the centre of the watch will point to the south. A similarexercise in the southern hemisphere will indicate the true north. This is also a crude method dependent upon the sun .
Legends
Every map contains a legend or a key. It lists the features and the signs or symbols used in the map for showing these features. As you know various types of features or phenomena are represented on maps. They relate to both land and sea and are shown with the help of conventional signs and symbols. The signs and symbols include lines, icons, alphabets, shadings and colours. As a convention, specific colours show certain area features.
Review Questions
1. Answer the following questions:
(i) What is a map? What are its advantages?
(ii) What is a scale? What purpose does it serve on a map?
(iii) What are the small scale maps? Give two examples of small scale maps.
(iv) What is a cadastral map?
(v) What are cardinal points?
2. Write short notes on:(i) Wall maps (ii) Linear Scale (iii) Base direction line.
3. In how many ways the earth can be mapped and what factors determine the amount of information given in a map? Discuss.
4. Describe various types of maps and their uses.
5. What are the different ways of expressing scale? Explain the merits and limitations of each method giving suitable examples.
6. What is R.F.?
REMEMEBR 7 STAGES
•Stage 1: introduction to types of maps;
• Stage 2: interpreting the shape of the ground from a map;
• Stage 3: plotting grid references;
Stage 4: measuring distances
•Stage 5: orienting the map to the ground;
•Stage 6: using the Silva compass; and
•Stage 7: conventional symbols.
INTERPRETING SHAPE OF THE GROUND FROM A MAP
When planning a route or looking for good positions for observation or fire, you must be able to look at the map and get a good mental picture of the ground.
STAGE 1 – TYPES OF MAPS
There are different types of maps. We will focus now on Topographical Maps.
1. Topographical maps
In order to do this, you must be able to:a.Interpret the shape of the ground from a map;
b.Definition of relief; and
c.Representation of height.
b.Definition of relief; and
c.Representation of height.
CONTOURS
•A contour is a line on a map joining two points of equal height, and is the standard method of showing relief on a topographical map.
Contours are shown at regular vertical intervals.
- On a 1:50,000 map the interval is 10 m.
INTERPRETATION OF CONTOURS
When contours are further apart, the slope is gentle and when contours are close together the greater the drop.
When contours are equal distance apart the slope is uniform:
a.Contours are continuous. No matter how far they travel, they always return to where they started. Except for a cliff.
b.When spacing of contours down a slope gets close together at the bottom, the slope is convex.
c. When spacing is further apart, the slope is concave.
STAGE 3 – PLOTTING GRID REFERENCES
•A grid is a rectangular square system of lines superimposed on a map, within which any point can be located.
Maps are normally printed so that north is on top.
•North / South lines are called Eastings because the numbers increase as they go East.
•East / West lines are called Northings because the numbers increase as they go North.
•North / South lines are called Eastings because the numbers increase as they go East.
•East / West lines are called Northings because the numbers increase as they go North.
1.bench marks;
2.trig points; and
3.spot height.
What are Eastings and Northings?
1.Eastings run – move left to right; and
2.Northings run – bottom to top.
What are the two most important things to remember when giving a grid?
1.Easting value first; and
2.never round up.
1.Easting value first; and
2.never round up.
What is the purpose of a contour line?
Joins points of equal heights.
•The Centre for Topographic Information provides this definition of a topographic map:"A topographic map is a detailed and accurate graphic representation of cultural and natural features on the ground."
•According to Cartographer's Kraak and Ormeling,"Traditionally, the main division of maps is into topographic and thematic maps. Topographic maps supply a general image of the earth's surface: roads, rivers, buildings, often the nature of the vegetation, the relief and the names of the various mapped objects."
•According to Cartographer's Kraak and Ormeling,"Traditionally, the main division of maps is into topographic and thematic maps. Topographic maps supply a general image of the earth's surface: roads, rivers, buildings, often the nature of the vegetation, the relief and the names of the various mapped objects."
•The study or discipline of topography, while interested in relief, is actually a much broader field of study which takes into account all natural and man made features of terrain.
Uses
•Topographic maps have multiple uses in the present day: any type of geographic planning or large-scale architecture; earth sciences and many other geographic disciplines; mining and other earth-based endeavours; and recreational uses such as hiking or, in particular, orienteering, which uses highly detailed maps in its standard requirements.
Map conventions
•The various features shown on the map are represented by conventional signs or symbols. For example, colors can be used to indicate a classification of roads. These signs are usually explained in the margin of the map, or on a separately published characteristic sheet]
•Topographic maps are also commonly called contour maps or topo maps. In the United States, where the primary national series is organized by a strict 7.5 minute grid, they are often called topo quads or quadrangles.
•Topographic maps conventionally show topography, or land contours, by means of contour lines. Contour lines are curves that connect contiguous points of the same altitude (isohypse). In other words, every point on the marked line of 100 m elevation is 100 m above mean sea level.
There are several rules to note when viewing topographic maps:
•The rule of V's: sharp-pointed vees usually are in stream valleys, with the drainage channel passing through the point of the vee, with the vee pointing upstream. This is a consequence of erosion.
•The rule of O's: closed loops are normally uphill on the inside and downhill on the outside, and the innermost loop is the highest area. If a loop instead represents a depression, some maps note this by short lines radiating from the inside of the loop, called "hachures".
•Spacing of contours: close contours indicate a steep slope; distant contours a shallow slope. Two or more contour lines merging indicates a cliff.
•Of course, to determine differences in elevation between two points, the contour interval, or distance in altitude between two adjacent contour lines, must be known, and this is given at the bottom of the map.
•These maps usually show not only the contours, but also any significant streams or other bodies of water, forest cover, built-up areas or individual buildings (depending on scale), and other features and points of interest.
•Today, topographic maps are prepared using photogrammetric interpretation of aerial photography. Older topographic maps were prepared using traditional surveying instruments.
•In most cases, contour intervals are consistent throughout a map. Sometimes dashed contour lines are present; these represent half the noted contour interval.
Understanding Topographical Maps
Understanding of surface depends on the ability to interpret topo maps. They-
•Are based on accurate surveys.
•Show a variety of landforms with carefully chosen symbols & signs.
•Shows natural features like hills, valleys, waterfalls,
•Also show man made features like roads, railways, buildings, bridges and canals.
TOPOSHEETS ARE:-
•Are prepared on a number of sheets since they are large scale maps.
•Each sheet gives the details of a part of the whole area.
•When these joined together, they form a map of the whole area.
•Are prepared on a number of sheets since they are large scale maps.
•Each sheet gives the details of a part of the whole area.
•When these joined together, they form a map of the whole area.
INTERPRETATION OF TOPO MAPS AND SURVEY MAPS
IT involves ability to follow the symbols portrayed in the map.
•Understand the information given in pictorial and written form
•Visualize the topography of the original area by interpreting the contour
•Spot heights skillfully
•Map reading is a practical skill.
•Can be developed only by reading topo map very minutely and mentally analyzing the details with the help of conventional signs & symbols given in their conventional colours'
•As the conventional symbols cannot cover all the graphical details, each topographical map sheet provides the necessary information in the margin for the users.
1.Identification of topographical maps
2.Reading the Grid reference
3.Scale (R.F.)
4.Representation of Relief by contours
5.Directions
6.Measuring distances and calculating distances
7.Drainage
8.Man-made and natural features
9.Means of transport in relation to relief
10.Land use and irrigation
11.Settlements
12. Inferring occupations
13. Importance of colours and tints in topographical survey sheets
14. Legend
15. Glossary of conventional signs and symbols used in survey maps
INFORMATION IN THE MARGINS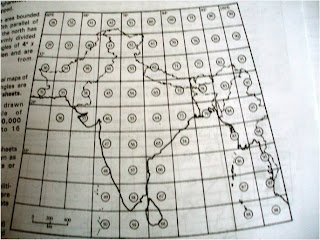
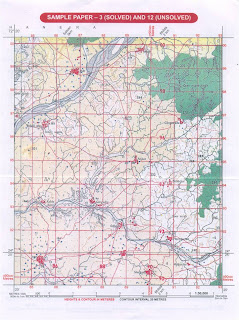
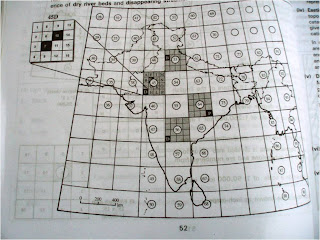
i)The number of the topo sheets: Topo sheets numbers can give an idea as to which part of India is shown on the map. For example, topo sheet numbers 45D/7, 45D/10 and 45 F/3 show parts of Gujarat and Rajashthan.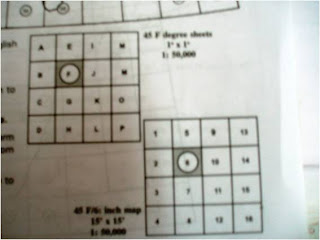

i)The number of the topo sheets: Topo sheets numbers can give an idea as to which part of India is shown on the map. For example, topo sheet numbers 45D/7, 45D/10 and 45 F/3 show parts of Gujarat and Rajashthan.

•Knowing the number of toposheet can give us a clue about the general physical relief of the region and its climate which can be confirmed by other information given in the map. 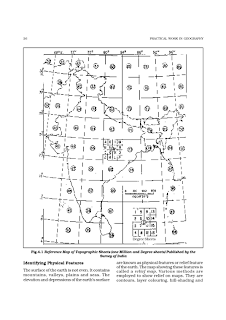

•Eg- since all toposheets are from India, it may be inferred that all the reigons represented by those topo sheets would have a tropical monsoon climate, with seasonal rainfall.
•Western Rajasthan – u may expect scanty rainfall- a fact which could be verified by the presence of dry river beds and disappearing streams.
•45D/7 shows a region of northern Guj, closer to the border of Rajasthan
•45D/10 lies in the southern part of Rajasthan close to the border of Gujarat region
•45F/3 lies in the western Rajasthan, near Jodhpur
•53B/7 shows a region in Punjab, close to the border of Haryana.
•56D/11 shows a region in north-east Karnataka.
•64P/13 shows a region in north-east Orissa. ii) Latitudinal and Longitudinal extent: These indicate in whichpart of the Earth the area is located.
•On a 4 degree topographical map, at least 4 lines of latitude and longitude can be seen. But as the scale of the topo map increases, the number of latitudes seen on the map decreases.
GRID REFERENCE
•A Grid is a set of lines used to find the exact location of places on a map.
•The National Grid Reference is a system of rectangular co-ordinate.
•The origin of the grid reference lies at a point in the south-west corner of the map.
•Thus any place on the map can be located by starting its distance east or north of the origin of the grid reference.
•Topo maps bear the national grid of squares drawn to the scale of 2 cm=1km with each square having a side measuring 1 km.
•These are sheets most commonly used for various purposes and are of vital practical importance.
•Vertical lines=Eastings since they are numbered from west to East
•Horizontal lines = Northings - they are numbered from South to North
•Net work of horizontal and vertical lines or the Eastings and Northings , is called the Grid.
READING THE GRID REFERENCE
i)Origin is the South –West (SW) corner of the map. The reading on the map is always taken with reference to this origin.
ii)Eastings are always read to the East of the origin.
iii)Northings are always read to the North of the origin.
•It is also identified as the Grid Reference


i)The readings are always taken to the right of the Eastings and to the North of the Northings.
ii)While giving a grid reference, Eastings are always stated first, followed by Northings
ii)While giving a grid reference, Eastings are always stated first, followed by Northings

Grid Reference of this picture is 2676
Four Figure Grid Reference:-•In four-figure grid reference, the first two figures are the eastings and the last two are the northings.
Six Figure Grid Reference:•For greater accuracy, a third figure may be added to two-figure eastings and northings.
i) Obtain the four figure reference by using first two digits of eastings and northings. ii)Then divide each kilometre into ten parts visually, both vertically & horizontally.
iii) Mark the division of eastings and the division of the northing corresponding to the location.
iv) The crossing point is the location of the reference point.
SCALE
•Refer to Survey Map No. 45D/7
•In the map, 1:50,000 is the R.F. of the map, which means that one unit on the map represents 50,000 units on the ground.
•For example, 1 cm on the map represents 50,000 cm on the ground.
•In the map, 1:50,000 is the R.F. of the map, which means that one unit on the map represents 50,000 units on the ground.
•For example, 1 cm on the map represents 50,000 cm on the ground.

(Scale of this toposheet is)
Scale-2cm:1 km or1:50,000
Scale-2cm:1 km or1:50,000
•R.F. or Representative Fraction is the ratio between the distance on the map and the corresponding distance on the ground in the same unit.•Therefore, R.F.
Distance on the map
____________________________
Distance on the ground
In the above map, R.F. = 1:50,000
____________________________
Distance on the ground
In the above map, R.F. = 1:50,000
This map is referred to as 1:50,000map and its scale is 2 cm=1km.
Representation of Relief on the Map and its Interpretation
•Earth’s surface – uneven – made up of hills, plains, plateaus, lowland which are varying in their elevation or heights from sea level.
•The total terrain is also called physical landscape.
•It can be represented on the maps through different methods, such as spot heights, contouring, etc.
•Surveying is considered a part of science of map making.
•Topographical maps are large-scale maps, they show a great deal of details about the relief.
•In Topographical survey, actual survey is carried out and different methods are used to represent relief on the map as follows.
i)Hachuring
ii)Hill shading
iii)Form lines
iv)Spot heights
v)Triangulation points
vi)Bench markscontours
i)Hachuring: are short lines representing directions of a slope.
- For steep slopes , they are drawn closer together than for the gentle slopes.
- on flat grounds they can not be used at all.
DISADVANTAGE: it gives no indication of the actual height and that both high plateau region and low plain are unshaded
The close hachuring of the high mountain regions tends to obscure other details of the map.
II) HILL SHADING: A method of representing relief on a map by depicting the shadows that would be cast by high ground if light were shining from a certain direction.
It can be defined as the addition of shadows to give the optical illusion of a third dimension, making hills stand out in relief. The shadows can be regarded as those which would be cast on an imaginary relief model of the ground when illuminated by parallel rays of light from a selected direction or directions.
In this map, it is assumed to be from north west at an angle of 45 degree with the horizon.
This method too gives a general idea of relief of the country by it does not give the actual height and that it is difficult to know whether a piece of land is sloping uphill or downhill.
THE DRAINAGE
•The term drainage basin describes an area drained collectively by the network of a river along with its tributaries and sub-tributaries of various dimensions.•An area drained by a single river is called its Catchment Area.
•A drainage system as seen in the topographical sheets usually develops a pattern which is related to the general structure of its basin.
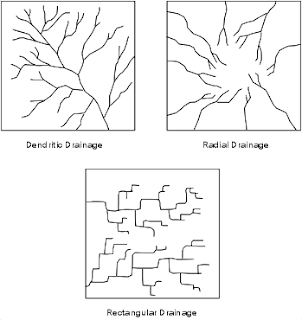
3 distinct patterns can be recognized
1)Dendritic:
1)Dendritic:


Dendritic drainage patterns are most common. They develop on a land surface where the underlying rock is of u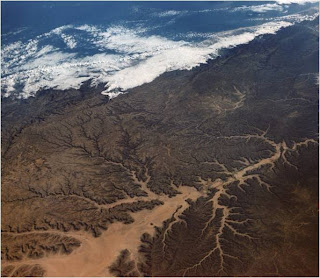 niform resistance to erosion.
•Dendritic drainage systems are the most common form of drainage system. The term dendritic comes from the Greek word "dendron", meaning tree, due to the resemblance of the system to a tree.
•In a dendritic system there is one main river (like the trunk of a tree), which was joined and formed by many smaller tributary rivers. They develop where the river channel follows the slope of the terrain.
•Dendritic systems form in V-shaped valleys; as a result, the rock types must be impervious and non-porous
 niform resistance to erosion.
 •Dendritic drainage systems are the most common form of drainage system. The term dendritic comes from the Greek word "dendron", meaning tree, due to the resemblance of the system to a tree.
•In a dendritic system there is one main river (like the trunk of a tree), which was joined and formed by many smaller tributary rivers. They develop where the river channel follows the slope of the terrain.
•Dendritic systems form in V-shaped valleys; as a result, the rock types must be impervious and non-porous
2. TRELLIS 


Rectangular drainage patterns develop where linear zones of weakness, such as joints or faults cause the streams to cut down along the weak areas in the rock.
•Trellis systems form in areas of alternating geology, particularly chalk and clay. The main river (the consequent) flows straight down hill.
•Subsequent streams develop perpendicular to the consequent along softer rock and erode it away, forming vales.
•The consequent river then cuts through the escarpments of harder rock.
•Obsequent streams flow down the dip slope of the escarpments to join the subsequent streams.
3. RADIAL

•Radial drainage patterns develop surrounding areas of high topography where elevation drops from a central high area to surrounding low areas.
SIGNIFICANCE OF COLOURS IN TOPOSHEETS
On toposheets colours are used to show certain features. Each colour used on a map has significance.1. BLACK – All names, river banks, broken ground, dry streams, surveyed trees, heights and their numbering, railway lines, telephone and telegraph lines, lines of latitude and longitude.
2. BLUE – Water features or water bodies that contain water.
3. GREEN – All wooded and forested areas, orchards, scattered trees and scrubs.
Note:- Prominent surveyed trees are shown in black. Surveyed trees have numbers on their trunks. They serve as landmarks and are not allowed to be cut.
4. YELLOW – All cultivated areas are shown with a yellow wash.
5. WHITE PATCHES – Uncultivable land
6. BROWN – Contour lines, their numbering, form lines, and sand features such as sand hills and dunes.
7. RED – Grid lines (eastings and northhings) and their numbering, roads, cart tracks, settlements, huts and buildings.
SETTLEMENTS
1. On a topo map, all settlements are shown by symbols in RED colour.2. The size of the symbol and size and style of letters used give an idea of the size of the settlement.
3. In the case of large cities, major roads are marked and named.
4. Deserted village cities, temporarily occupied huts are also shown.
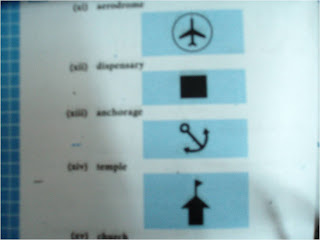
5. Places of worship, forts, water towers, burial grounds, police stations, post office, dak bungalow, circuit houses, etc. are indicated by suitable symbols.
NOTE – Site is the land on which the settlement (village or town) is built.
Dense settlements : Fertile plains and wide river valleys.
· Sparse Settlements : forests, deserts, mountain slopes, plateaus and hill tops with poor vegetation·
Absence of Settlements: Swamps, marsh land, sandy deserts, thick impenetrable forests, flood-prone areas, steep mountain slopes.
OCCUPATION AND MAP FEATURES
AGRICULTURE – Level land with yellow wash; many wellsLUMBERING: Forests
CATTLE REARING – Pastures, meadows, grasslands, presence of road in highland region (sheep)
FISHING – Plenty of rivers
MINING –Stony wastes, quaries, limestone beds
TRADE – Dense settlements near road
INDUSTRY – Large settlements near roads and railways, presence of raw materials, (like making, cement industry near limestone beds)
TOURISM – hotels and inns
APPROXIMATE OR RELATIVE HEIGHT-is height is not taken from sea level but with respect to the surrounding area. It may be the height of a dam, bridge, sand dune or it can be the depth of a well, tank, hill or river canal, for example , 3r, 5r, 8r, etc.
EXAMPLE:3r - the relative depth of perennial lined well in 3 metres
●5r – the relative height of dry tank is 5 metres
NOTE: CHECK THE SYMBOL – if it is tank, dam, bridge, embankment, etc then write the answer this way - the relative height of .............................. is ................meters.
A5 SIGNIFICANCE OF COLORS IN TOPOSHEETS
SIGNIFICANCE OF COLOURS IN TOPOSHEETS
On toposheets colours are used to show certain features. Each colour used on a map has significance.
1. BLACK – All names, river banks, broken ground, dry streams, surveyed trees, heights and their numbering, railway lines, telephone and telegraph lines, lines of latitude and longitude
2. BLUE – Water features or water bodies that contain water.
3. GREEN – All wooded and forested areas, orchards, scattered trees and scrubs.
Note:- Prominent surveyed trees are shown in black. Surveyed trees have numbers on their trunks. They serve as landmarks and are not allowed to be cut.
4. YELLOW – All cultivated areas are shown with a yellow wash.
5. WHITE PATCHES – Uncultivable land
6. BROWN – Contour lines, their numbering, form lines, and sand features such as sand hills and dunes
7. RED – Grid lines (eastings and northhings) and their numbering, roads, cart tracks, settlements, huts and buildings.
SETTLEMENTS
1. On a topo map, all settlements are shown by symbols in RED colour.
2. The size of the symbol and size and style of letters used give an idea of the size of the settlement.
3. In the case of large cities, major roads are marked and named.
4. Deserted village cities, temporarily occupied huts are also shown.
5. Places of worship, forts, water towers, burial grounds, police stations, post office, dak bungalow, circuit houses, etc. are indicated by suitable symbols.
NOTE – Site is the land on which the settlement (village or town) is built.
· Dense settlements : Fertile plains and wide river valleys.
· Sparse Settlements : forests, deserts, mountain slopes, plateaus and hill tops with poor vegetation
· Absence of Settlements: Swamps, marsh land, sandy deserts, thick impenetrable forests, flood-prone areas, steep mountain slopes.
OCCUPATION AND MAP FEATURES
AGRICULTURE – Level land with yellow wash; many wells
LUMBERING: Forests
CATTLE REARING – Pastures, meadows, grasslands, presence of road in highland region (sheep)
FISHING – Plenty of rivers
MINING –Stony wastes, quaries, limestone beds
TRADE – Dense settlements near road
INDUSTRY – Large settlements near roads and railways, presence of raw materials, (like making, cement industry near limestone beds)
TOURISM – hotels and inns
APPROXIMATE OR RELATIVE HEIGHT
This height is not taken from sea level but with respect to the surrounding area. It may be the height of a dam, bridge, sand dune or it can be the depth of a well, tank, hill or river canal, for example , 3r, 5r, 8r, etc.
EXAMPLE:
3r - the relative depth of perennial lined well in 3 metres ●3r
5r – the relative height of dry tank is 5 metres Ο5r
NOTE: CHECK THE SYMBOL – if it is tank, dam, bridge, embankment, etc then write the answer this way - the relative height of .............................. is ................meters.
A04 INTERPRETING TOPO SHEETS - PART 2
Man-made and Natural Features
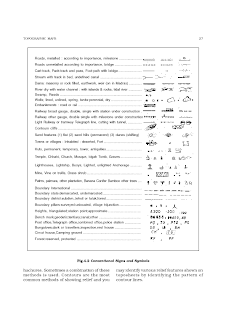
•Toposheets shows various details of an area- natural and man made features by means of conventional signs(legends), contours and pictorial diagrams in conventional colours.
•Natural features – rivers, streams, sand features, trees, broken grounds, natural ponds, unlined wells, jungles, depresions (Dep), islands (in the exposed river beds), physical features like hills, waterfalls, spurs, river valleys and cliffs, shown by contours and their heights.
•MAN made features – surveyed trees, queries, permanent huts, causeways, mines, metalled and unmetalled roads, pack tracts, cart tracts, artificial lakes with embankments, boundaries (national and international), post offices, police chowkies and inspection bungalows.
Means of Transport in Relation to Relief
•Transport always depend on the type of relief and drainage
•Eg. Very high altitudes, mountaineous areas-only roads and no railway tracks- difficult to build at such heights
•On the map-roads are shown by means of symbols of cart tracks, pack tracts, metalled roads, unmetalled roads, footpaths with a bridge.
•Main towns- well connected by metalled roads show economic devp of the area-is the indication of trade being carried on.
•Hence town shows well developed.
•Causeways are raised platforms across a dry stream.
•During dry season when the stream dries up, people make a habit of crossing it.
•Thus, a footway is formed.
•Presence of many causeways shows that the area gets seasonal or scanty rainfall.


DIRECTIONS
•Directions are important for physical as well as urban features.
•Physical features- directions of rivers, streams,
•Urban cities from one another
DIRECTION-TO RIVER AND RIVER BANKS
•Need to know which direction river flows.
•REMEMBER THESE STEPS:
1.First look at the spot heights to determine the slope of the land
2.To know which side/bank of the river a place is situated, one has to locate the source of the river. Having located the direction of the river, imagine yourself standing at the source of the river facing the main river facing the main river. Now to your right is right bank and to your left is the left bank.
Calculation of Area
•Area= Length x Breadth
•In topo maps, each grid (square) 2cm X 2cm or 1 km to 1 km as per the scale 2 cm=1 km
•Therefore , area of each square is
4 sq cm (on the map)= 1 sq km (on the ground)
In metres, this can be expressed as
Area of each square (i.e. 4 sq cm) = 1000 X 1000
or 1,000,000 sq m.
•In topo maps, each grid (square) 2cm X 2cm or 1 km to 1 km as per the scale 2 cm=1 km
•Therefore , area of each square is
4 sq cm (on the map)= 1 sq km (on the ground)
In metres, this can be expressed as
Area of each square (i.e. 4 sq cm) = 1000 X 1000
or 1,000,000 sq m.
If there are some incomplete squares, area can be calculated as follows:
-Note the number of completed squares
-Squares covered half are taken as ½
-Squares covering less than half area are taken as 1/3
-Squares covering more than half of the area are taken as 2/3
-All these estimated squares are added together and the sum is multiplied by the scale of the area given out above to obtain the desired area.
LAND USE
•In topo map location of veg is closely related to relief.
•In the highlands, vegetation is shown –green colour along with contours in brown showing elevation.
•To show density of wooded area, different terms used:
•Dense forest, open-mixed forest, open jungle, fairly-mixed jungle, dense-mixed jungle, mixed jungle, Reserved Forest (RF), Protected Forest (PF), fairly mixed jungle with bamboo, dense mixed jungle with bamboo.
•The exterior boundaries of areas of Reserved or Protected forest are shown by green ribands .
•White patch in plain shows bad land or rocky, uncultivable land.
•In such land, following features are found
Open scrub – scrub land where mostly sheep and goat rearing is practiced
•Stony waste – the land which is mostly covered with rock boulders and stones and cultivation is not possible.
•In such land, following features are found
Open scrub – scrub land where mostly sheep and goat rearing is practiced
•Stony waste – the land which is mostly covered with rock boulders and stones and cultivation is not possible.
SHEET ROCKS:-
•Sheet rocks – a region mostly covered with a sheet of rock.
•Rock outcrop – In such region subsoil is exposed and cultivation is not possible.
•Broken ground – developed because of absence of natural vegetation on both the banks of the river. It is common in the desert area and in the areas of gully erosion.This is formed due to floods which occur during rainy season. Because of floods, the top soil is washed away developing into bad land which has loose soil and is uncultivable.
LOW LANDS:-
•Plains which are situated at lower level are mostly characterized by a meandering river.
•A disappearing stream shows a desert or limestone area
•Presence of canal, wells, tube wells and tanks indicate use of land for agriculture by means of irrigation
•A meandering river shows a flat area
•Perennial lined wells indicate a higher water table and are shown by blue dots.
•Presence of dry streams, dry ponds, exposed river beds and broken land shown in black indicate an area with scanty rainfall or seasonal rainfall or a desert region.•Plains which are situated at lower level are mostly characterized by a meandering river.
•A disappearing stream shows a desert or limestone area
•Presence of canal, wells, tube wells and tanks indicate use of land for agriculture by means of irrigation
•A meandering river shows a flat area
•Perennial lined wells indicate a higher water table and are shown by blue dots.
•Settlements are generally found on either side of river-wherever irrigation by canals or perennial lined wells is available
MEANS OF IRRIGATION
•Irrigation largely depends on relief and land use pattern of area (blue)
•Hilly region- no cultivation is possible, hence there is no need for irrigation
•On the flat lands which are coloured yellow, one can see blue, round spots which represent perennial lined wells. – therefore one can say that the main source of irrigation in such areas are wells and the occupation of people is farming.
•Other means of irrigation are canals, ponds, artifical lakes withj embankments and river in case it is perennial.
•Presence of dry streams and dry ponds with uncultivable lands shown in white indicates that the rainfall in the area is scanty.
•Presence of artificial man-made lake with embankment shows that water is being stored in off season and is used for irrigation through canals.
OCCUPATIONS
•Occupations have to be inferred from toposheets as there are no symbols to show the occupations of people.
•Sometimes, certain names like ‘farms’, ‘orchards’ provide some evidence of these occupations.
•The following list gives you some information about occupation of the people from a topo-sheet.
•Sometimes, certain names like ‘farms’, ‘orchards’ provide some evidence of these occupations.
•The following list gives you some information about occupation of the people from a topo-sheet.
OCCUPATIONS EVIDENCES
Forestry, lumbering Forest or Green Patch
Agriculture Yellow Patch or orchards with many wells
Cattle-grazing or sheep rearing Meadows or Scrub, grasslands, meadows, pastures
Quarrying and mining Mines and Quarries, lime stone beds
Trade Settlement near main roads, ports, rivers, etc – dense settlement
Entertainment & Cultural devpmnt Gold Courses, Parks, Rifle Ranges, etc
Industry Factory, mines, large settlements near roads and
Industry Factory, mines, large settlements near roads and
railways, presence of raw materials (lime making and
cement industry near limestone beds)
Fishery Coast,l akes, rivers, etc
Tourism Hotels and Inns
Fishery Coast,l akes, rivers, etc
Tourism Hotels and Inns
•Thus, the occupation of the people of an area can be inferred from the following :
•Topography of land
•Size of settlement
•Presence of quarry and mines
•Communication network indicating trade
•Topography of land
•Size of settlement
•Presence of quarry and mines
•Communication network indicating trade
REMEMEMBER FEW POINTS:
HACHURING: Hachuring are short lines representing directions of a slope. For steep slopes they are drawn closer together than for the gentle slopes. However on flat ground, they cannot be used.SPOT HEIGHTS: Spot heights are used to provide more information about land surfaces between the contours. These are represented by a number preceded by a dot. for example ●340
TRIANGULATION POINTS: When the spot heights are accurately surveyed
 , the dot is enclosed within a triangle and are called the triangulation points.
BENCH MARKS: The marks inscribed stones or shown on buildings to indicate the exact height determined through the surveys, are called the Bench Marks. These marks are shown by letters BM along with height . eg. BM 590
INDEX CONTOURS: To make the maps easier to read, contour lines are thickened at regular intervals. These thickened contour lines are called index contours.
FORM LINES: These are broken lines between contour lines to indicate minor details. They show approximate heights above sea level as they are used to indicate the elevations of the area which are not accessible for proper suvey.Hence they are drawn as broken lines and are called 'form lines'.
TRIGONOMETRICAL STATIONS: These points show height and are marked by a triangle and height. eg.∆ 877
SOME IMPORTANT QUESTIONS
1. What do you understand by R.F.?
R.F. stands for representative fraction. It is a ratio between the distance on a map and the actual distance on the ground. On this map the R.F. is 1:50,000 which means that 1 cm on the map represents 500 m on the ground, or, 1 cm on the ground represents 0.5 km on the ground.
2. What is Contour Interval?
Contour Interval is the difference in height between two consecutive contour lines. In the survey sheet of India, the contour interval is 20 metres.
3. What are contours?State their properties.
The imaginary lines which are drawn on a map to joining places having the same height above the sea level.
Properties of the contours are as follows:
* contour lines join all places of the same height above sea level.
* distant contour lines indicate gentle slopes.
* closely spaced contour lines indicate steepy slopes.
* uniformly spaced contour lines indicate a uniform slope.
* contour intervals also differ according to the scale of the map.
* contour lines generally do not intersect each other on the map. However in some places they intersect , where it indicates a steeper cliff or a waterfall.
4. What is Grid? Give the importance of National Grid?An imaginary network of equidstance lines printed on map. It enables in locating the position of a place to be accurately defined in a simple way than by using latitudes and longitudes. National Grid is a co-ordinate used for map reference by ordinance survey.
5. What do you understand by 'scale' of a map? What are the 3 methods of indicating scale on maps?
A scale is a ratio of distance between any two points on a map to the corresponding distance between the same two points on the actual ground.
Three methods of indicating scale on maps are:
i. By a statement
ii. By Representative Fraction
iii. By graphical scale or linear scale
6. What is statement of scale?
It expresses the relationship of map to ground in words, such as one centimeter to five kilometres. It is expressed as 1 cm : 5 km.
7. What are cardinal points?
The four main directions of North, South, East and West are known as cardinal points.
8. What is 'causeway'?
It is a raised metalled road across a minor stream or low lying marshy area at a shallow point.
9. What is Grid square?
It is an area of 1 sq km demarcated on the toposheet by the intersection of Grid line. Each Grid square measures 2 sq cm distance of map.
10. What is meant by the term Fire Line? Account for the necessity of Fire Lines in the jungle area of the given map extract.
'Fire Line' means a clearing or a gap or an empty space that runs through a forest area. It is often also a trench which is filled with water or sand. This is done to stop the spread of fire in the forest.
P.N. (make sure you write- to stop/prevent the spread of fire- You can not stop forest fire but you can prevent the spread of fire)
11. What advantage does a Representative Fraction have over a verbal scale?
It has universal application as it does not use any unit.
12. What do the figures 1:50,000 printed on the map extract mean?
The figures 1:50,000 mean that one cm on the map represents 50,000 cm on the ground i.e. 1 unit on the map is equal to 50,000 units on the ground. It also means Representative Fraction.
13. What is the meaning of the conventional sign given on the map?
PTO - It means Post and Telegraph Office.
14. What does the brown line in toposheet indicate?
The brown line in the grid squre ______ is the indication of a contour line.
15. Explain why there are so many causeways along the metalled road.
There are many causeways along the metalled road because of seasonal streams/dry streams.
16. On the map, what does the following indicate: i. Green wash ii. yellow wash
The green colur indicates that it is fit for forestry/open mixed jungle and the yellow colour indicates that the land is fit for agriculture/cultivation/farming.
17. Name the geographical feature represented by white patches in the middle of a particular river.
The geographical feature represented by the white patches in the middle of the river is an island and rocks/accumulation of pebbles.
18. What does 3 r written in the tank in grid square indicate?
It indicates the relative height/depth of the tank which is 3 m .
Please Note- If you see letter 'r' , it has following meanings.
a) If you locate 'r' near the bank of a river, then it tells you about the depth of the river at that point.
b) If you see it near a Tank, then it is again the depth of the tank.
c) If it seen near a Sand Dune, then it is the height of the dune.
19. What is the general land use of i. even ground ii uneven ground?
The general uses of even ground are agriculture or cultivation or farming, for construction of canals, for laying of railway lines, markets and development of townships and the general uses of uneven ground are vegetation, forests, grazing, forestry, and mining.
20. What does the word brackish in the toposheet indicate?
It indicates the water of the lined well is salty or saline, not fit for agriculture and drinking.
21. What does the letters LY indicate?
It indicates a subdivision of a survey map indicating an area of 100 x 100 km.
22. Why do you hve the letters QC and QD side by side?
QC or QD indicate a subdivision of a survey map 100 x 100 km. Between QC and QD, Es are 00.
23. Why are directions on map important?
Since mapping is primarily a science whereabouts a student of geography, should, therefore, be familiar with directions and also the methods of finding out directions on different occasions and in various circumstances.
24. What is a Watershed?
A watershed or water divide is a ridge which separates the tributaries draining towards one side of it from those drawing towards the other. A watershed is never a halfway up a slope and on the two sides of it, the slope must be opposite and downwards.
LESSON WILL BE UPDATED. PLZ SEND YOUR COMMENTS. IF U HV READ THE LESSON FROM THE BLOG, PLZ DO PASS COMMENTS UNDER THE COMMENT SECTION. PLZ TAKE SOME TROUBLE. COMMENTS CAN BE SUGGESTIONS TOO. ONLY THEN I WILL KNOW HOW MANY OF U R FOLLOWING THIS BLOG. THANK YOU FOR YOUR TROUBLE.
Subscribe to:
Posts (Atom)