SIGNIFICANCE OF COLOURS IN TOPOSHEETS
On toposheets colours are used to show certain features. Each colour used on a map has significance.
1. BLACK – All names, river banks, broken ground, dry streams, surveyed trees, heights and their numbering, railway lines, telephone and telegraph lines, lines of latitude and longitude
2. BLUE – Water features or water bodies that contain water.
3. GREEN – All wooded and forested areas, orchards, scattered trees and scrubs.
Note:- Prominent surveyed trees are shown in black. Surveyed trees have numbers on their trunks. They serve as landmarks and are not allowed to be cut.
4. YELLOW – All cultivated areas are shown with a yellow wash.
5. WHITE PATCHES – Uncultivable land
6. BROWN – Contour lines, their numbering, form lines, and sand features such as sand hills and dunes
7. RED – Grid lines (eastings and northhings) and their numbering, roads, cart tracks, settlements, huts and buildings.
SETTLEMENTS
1. On a topo map, all settlements are shown by symbols in RED colour.
2. The size of the symbol and size and style of letters used give an idea of the size of the settlement.
3. In the case of large cities, major roads are marked and named.
4. Deserted village cities, temporarily occupied huts are also shown.
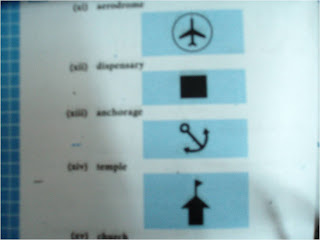
5. Places of worship, forts, water towers, burial grounds, police stations, post office, dak bungalow, circuit houses, etc. are indicated by suitable symbols.
NOTE – Site is the land on which the settlement (village or town) is built.
· Dense settlements : Fertile plains and wide river valleys.
· Sparse Settlements : forests, deserts, mountain slopes, plateaus and hill tops with poor vegetation
· Absence of Settlements: Swamps, marsh land, sandy deserts, thick impenetrable forests, flood-prone areas, steep mountain slopes.
OCCUPATION AND MAP FEATURES
AGRICULTURE – Level land with yellow wash; many wells
LUMBERING: Forests
CATTLE REARING – Pastures, meadows, grasslands, presence of road in highland region (sheep)
FISHING – Plenty of rivers
MINING –Stony wastes, quaries, limestone beds
TRADE – Dense settlements near road
INDUSTRY – Large settlements near roads and railways, presence of raw materials, (like making, cement industry near limestone beds)
TOURISM – hotels and inns
APPROXIMATE OR RELATIVE HEIGHT
This height is not taken from sea level but with respect to the surrounding area. It may be the height of a dam, bridge, sand dune or it can be the depth of a well, tank, hill or river canal, for example , 3r, 5r, 8r, etc.
EXAMPLE:
3r - the relative depth of perennial lined well in 3 metres ●3r
5r – the relative height of dry tank is 5 metres Ο5r
NOTE: CHECK THE SYMBOL – if it is tank, dam, bridge, embankment, etc then write the answer this way - the relative height of .............................. is ................meters.

Showing posts with label INTERPRETATION OF TOPOGRAPHICAL MAPS. Show all posts
Showing posts with label INTERPRETATION OF TOPOGRAPHICAL MAPS. Show all posts
Friday, June 19, 2009


A04 INTERPRETING TOPO SHEETS - PART 2
Man-made and Natural Features
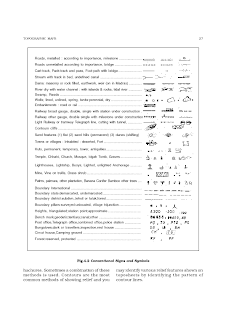
•Toposheets shows various details of an area- natural and man made features by means of conventional signs(legends), contours and pictorial diagrams in conventional colours.
•Natural features – rivers, streams, sand features, trees, broken grounds, natural ponds, unlined wells, jungles, depresions (Dep), islands (in the exposed river beds), physical features like hills, waterfalls, spurs, river valleys and cliffs, shown by contours and their heights.
•MAN made features – surveyed trees, queries, permanent huts, causeways, mines, metalled and unmetalled roads, pack tracts, cart tracts, artificial lakes with embankments, boundaries (national and international), post offices, police chowkies and inspection bungalows.
Means of Transport in Relation to Relief
•Transport always depend on the type of relief and drainage
•Eg. Very high altitudes, mountaineous areas-only roads and no railway tracks- difficult to build at such heights
•On the map-roads are shown by means of symbols of cart tracks, pack tracts, metalled roads, unmetalled roads, footpaths with a bridge.
•Main towns- well connected by metalled roads show economic devp of the area-is the indication of trade being carried on.
•Hence town shows well developed.
•Causeways are raised platforms across a dry stream.
•During dry season when the stream dries up, people make a habit of crossing it.
•Thus, a footway is formed.
•Presence of many causeways shows that the area gets seasonal or scanty rainfall.




DIRECTIONS
•Directions are important for physical as well as urban features.
•Physical features- directions of rivers, streams,
•Urban cities from one another
DIRECTION-TO RIVER AND RIVER BANKS
•Need to know which direction river flows.
•REMEMBER THESE STEPS:
1.First look at the spot heights to determine the slope of the land
2.To know which side/bank of the river a place is situated, one has to locate the source of the river. Having located the direction of the river, imagine yourself standing at the source of the river facing the main river facing the main river. Now to your right is right bank and to your left is the left bank.
Calculation of Area
•Area= Length x Breadth
•In topo maps, each grid (square) 2cm X 2cm or 1 km to 1 km as per the scale 2 cm=1 km
•Therefore , area of each square is
4 sq cm (on the map)= 1 sq km (on the ground)
In metres, this can be expressed as
Area of each square (i.e. 4 sq cm) = 1000 X 1000
or 1,000,000 sq m.
•In topo maps, each grid (square) 2cm X 2cm or 1 km to 1 km as per the scale 2 cm=1 km
•Therefore , area of each square is
4 sq cm (on the map)= 1 sq km (on the ground)
In metres, this can be expressed as
Area of each square (i.e. 4 sq cm) = 1000 X 1000
or 1,000,000 sq m.
If there are some incomplete squares, area can be calculated as follows:
-Note the number of completed squares
-Squares covered half are taken as ½
-Squares covering less than half area are taken as 1/3
-Squares covering more than half of the area are taken as 2/3
-All these estimated squares are added together and the sum is multiplied by the scale of the area given out above to obtain the desired area.
LAND USE
•In topo map location of veg is closely related to relief.
•In the highlands, vegetation is shown –green colour along with contours in brown showing elevation.
•To show density of wooded area, different terms used:
•Dense forest, open-mixed forest, open jungle, fairly-mixed jungle, dense-mixed jungle, mixed jungle, Reserved Forest (RF), Protected Forest (PF), fairly mixed jungle with bamboo, dense mixed jungle with bamboo.
•The exterior boundaries of areas of Reserved or Protected forest are shown by green ribands .
•White patch in plain shows bad land or rocky, uncultivable land.
•In such land, following features are found
Open scrub – scrub land where mostly sheep and goat rearing is practiced
•Stony waste – the land which is mostly covered with rock boulders and stones and cultivation is not possible.
•In such land, following features are found
Open scrub – scrub land where mostly sheep and goat rearing is practiced
•Stony waste – the land which is mostly covered with rock boulders and stones and cultivation is not possible.
SHEET ROCKS:-
•Sheet rocks – a region mostly covered with a sheet of rock.
•Rock outcrop – In such region subsoil is exposed and cultivation is not possible.
•Broken ground – developed because of absence of natural vegetation on both the banks of the river. It is common in the desert area and in the areas of gully erosion.This is formed due to floods which occur during rainy season. Because of floods, the top soil is washed away developing into bad land which has loose soil and is uncultivable.
•Sheet rocks – a region mostly covered with a sheet of rock.
•Rock outcrop – In such region subsoil is exposed and cultivation is not possible.
•Broken ground – developed because of absence of natural vegetation on both the banks of the river. It is common in the desert area and in the areas of gully erosion.This is formed due to floods which occur during rainy season. Because of floods, the top soil is washed away developing into bad land which has loose soil and is uncultivable.
LOW LANDS:-
•Plains which are situated at lower level are mostly characterized by a meandering river.
•A disappearing stream shows a desert or limestone area
•Presence of canal, wells, tube wells and tanks indicate use of land for agriculture by means of irrigation
•A meandering river shows a flat area
•Perennial lined wells indicate a higher water table and are shown by blue dots.
•Presence of dry streams, dry ponds, exposed river beds and broken land shown in black indicate an area with scanty rainfall or seasonal rainfall or a desert region.•Plains which are situated at lower level are mostly characterized by a meandering river.
•A disappearing stream shows a desert or limestone area
•Presence of canal, wells, tube wells and tanks indicate use of land for agriculture by means of irrigation
•A meandering river shows a flat area
•Perennial lined wells indicate a higher water table and are shown by blue dots.
•Settlements are generally found on either side of river-wherever irrigation by canals or perennial lined wells is available
MEANS OF IRRIGATION
•Irrigation largely depends on relief and land use pattern of area (blue)
•Hilly region- no cultivation is possible, hence there is no need for irrigation
•On the flat lands which are coloured yellow, one can see blue, round spots which represent perennial lined wells. – therefore one can say that the main source of irrigation in such areas are wells and the occupation of people is farming.
•Other means of irrigation are canals, ponds, artifical lakes withj embankments and river in case it is perennial.
•Presence of dry streams and dry ponds with uncultivable lands shown in white indicates that the rainfall in the area is scanty.
•Presence of artificial man-made lake with embankment shows that water is being stored in off season and is used for irrigation through canals.
•Hilly region- no cultivation is possible, hence there is no need for irrigation
•On the flat lands which are coloured yellow, one can see blue, round spots which represent perennial lined wells. – therefore one can say that the main source of irrigation in such areas are wells and the occupation of people is farming.
•Other means of irrigation are canals, ponds, artifical lakes withj embankments and river in case it is perennial.
•Presence of dry streams and dry ponds with uncultivable lands shown in white indicates that the rainfall in the area is scanty.
•Presence of artificial man-made lake with embankment shows that water is being stored in off season and is used for irrigation through canals.
OCCUPATIONS
•Occupations have to be inferred from toposheets as there are no symbols to show the occupations of people.
•Sometimes, certain names like ‘farms’, ‘orchards’ provide some evidence of these occupations.
•The following list gives you some information about occupation of the people from a topo-sheet.
•Sometimes, certain names like ‘farms’, ‘orchards’ provide some evidence of these occupations.
•The following list gives you some information about occupation of the people from a topo-sheet.
OCCUPATIONS EVIDENCES
Forestry, lumbering Forest or Green Patch
Agriculture Yellow Patch or orchards with many wells
Cattle-grazing or sheep rearing Meadows or Scrub, grasslands, meadows, pastures
Quarrying and mining Mines and Quarries, lime stone beds
Trade Settlement near main roads, ports, rivers, etc – dense settlement
Entertainment & Cultural devpmnt Gold Courses, Parks, Rifle Ranges, etc
Industry Factory, mines, large settlements near roads and
Industry Factory, mines, large settlements near roads and
railways, presence of raw materials (lime making and
cement industry near limestone beds)
Fishery Coast,l akes, rivers, etc
Tourism Hotels and Inns
Fishery Coast,l akes, rivers, etc
Tourism Hotels and Inns
•Thus, the occupation of the people of an area can be inferred from the following :
•Topography of land
•Size of settlement
•Presence of quarry and mines
•Communication network indicating trade
•Topography of land
•Size of settlement
•Presence of quarry and mines
•Communication network indicating trade
REMEMEMBER FEW POINTS:
HACHURING: Hachuring are short lines representing directions of a slope. For steep slopes they are drawn closer together than for the gentle slopes. However on flat ground, they cannot be used.SPOT HEIGHTS: Spot heights are used to provide more information about land surfaces between the contours. These are represented by a number preceded by a dot. for example ●340
TRIANGULATION POINTS: When the spot heights are accurately surveyed
 , the dot is enclosed within a triangle and are called the triangulation points.
BENCH MARKS: The marks inscribed stones or shown on buildings to indicate the exact height determined through the surveys, are called the Bench Marks. These marks are shown by letters BM along with height . eg. BM 590
INDEX CONTOURS: To make the maps easier to read, contour lines are thickened at regular intervals. These thickened contour lines are called index contours.
FORM LINES: These are broken lines between contour lines to indicate minor details. They show approximate heights above sea level as they are used to indicate the elevations of the area which are not accessible for proper suvey.Hence they are drawn as broken lines and are called 'form lines'.
TRIGONOMETRICAL STATIONS: These points show height and are marked by a triangle and height. eg.∆ 877
SOME IMPORTANT QUESTIONS
1. What do you understand by R.F.?
R.F. stands for representative fraction. It is a ratio between the distance on a map and the actual distance on the ground. On this map the R.F. is 1:50,000 which means that 1 cm on the map represents 500 m on the ground, or, 1 cm on the ground represents 0.5 km on the ground.
2. What is Contour Interval?
Contour Interval is the difference in height between two consecutive contour lines. In the survey sheet of India, the contour interval is 20 metres.
3. What are contours?State their properties.
The imaginary lines which are drawn on a map to joining places having the same height above the sea level.
Properties of the contours are as follows:
* contour lines join all places of the same height above sea level.
* distant contour lines indicate gentle slopes.
* closely spaced contour lines indicate steepy slopes.
* uniformly spaced contour lines indicate a uniform slope.
* contour intervals also differ according to the scale of the map.
* contour lines generally do not intersect each other on the map. However in some places they intersect , where it indicates a steeper cliff or a waterfall.
4. What is Grid? Give the importance of National Grid?An imaginary network of equidstance lines printed on map. It enables in locating the position of a place to be accurately defined in a simple way than by using latitudes and longitudes. National Grid is a co-ordinate used for map reference by ordinance survey.
5. What do you understand by 'scale' of a map? What are the 3 methods of indicating scale on maps?
A scale is a ratio of distance between any two points on a map to the corresponding distance between the same two points on the actual ground.
Three methods of indicating scale on maps are:
i. By a statement
ii. By Representative Fraction
iii. By graphical scale or linear scale
6. What is statement of scale?
It expresses the relationship of map to ground in words, such as one centimeter to five kilometres. It is expressed as 1 cm : 5 km.
7. What are cardinal points?
The four main directions of North, South, East and West are known as cardinal points.
8. What is 'causeway'?
It is a raised metalled road across a minor stream or low lying marshy area at a shallow point.
9. What is Grid square?
It is an area of 1 sq km demarcated on the toposheet by the intersection of Grid line. Each Grid square measures 2 sq cm distance of map.
10. What is meant by the term Fire Line? Account for the necessity of Fire Lines in the jungle area of the given map extract.
'Fire Line' means a clearing or a gap or an empty space that runs through a forest area. It is often also a trench which is filled with water or sand. This is done to stop the spread of fire in the forest.
P.N. (make sure you write- to stop/prevent the spread of fire- You can not stop forest fire but you can prevent the spread of fire)
11. What advantage does a Representative Fraction have over a verbal scale?
It has universal application as it does not use any unit.
12. What do the figures 1:50,000 printed on the map extract mean?
The figures 1:50,000 mean that one cm on the map represents 50,000 cm on the ground i.e. 1 unit on the map is equal to 50,000 units on the ground. It also means Representative Fraction.
13. What is the meaning of the conventional sign given on the map?
PTO - It means Post and Telegraph Office.
14. What does the brown line in toposheet indicate?
The brown line in the grid squre ______ is the indication of a contour line.
15. Explain why there are so many causeways along the metalled road.
There are many causeways along the metalled road because of seasonal streams/dry streams.
16. On the map, what does the following indicate: i. Green wash ii. yellow wash
The green colur indicates that it is fit for forestry/open mixed jungle and the yellow colour indicates that the land is fit for agriculture/cultivation/farming.
17. Name the geographical feature represented by white patches in the middle of a particular river.
The geographical feature represented by the white patches in the middle of the river is an island and rocks/accumulation of pebbles.
18. What does 3 r written in the tank in grid square indicate?
It indicates the relative height/depth of the tank which is 3 m .
Please Note- If you see letter 'r' , it has following meanings.
a) If you locate 'r' near the bank of a river, then it tells you about the depth of the river at that point.
b) If you see it near a Tank, then it is again the depth of the tank.
c) If it seen near a Sand Dune, then it is the height of the dune.
19. What is the general land use of i. even ground ii uneven ground?
The general uses of even ground are agriculture or cultivation or farming, for construction of canals, for laying of railway lines, markets and development of townships and the general uses of uneven ground are vegetation, forests, grazing, forestry, and mining.
20. What does the word brackish in the toposheet indicate?
It indicates the water of the lined well is salty or saline, not fit for agriculture and drinking.
21. What does the letters LY indicate?
It indicates a subdivision of a survey map indicating an area of 100 x 100 km.
22. Why do you hve the letters QC and QD side by side?
QC or QD indicate a subdivision of a survey map 100 x 100 km. Between QC and QD, Es are 00.
23. Why are directions on map important?
Since mapping is primarily a science whereabouts a student of geography, should, therefore, be familiar with directions and also the methods of finding out directions on different occasions and in various circumstances.
24. What is a Watershed?
A watershed or water divide is a ridge which separates the tributaries draining towards one side of it from those drawing towards the other. A watershed is never a halfway up a slope and on the two sides of it, the slope must be opposite and downwards.
LESSON WILL BE UPDATED. PLZ SEND YOUR COMMENTS. IF U HV READ THE LESSON FROM THE BLOG, PLZ DO PASS COMMENTS UNDER THE COMMENT SECTION. PLZ TAKE SOME TROUBLE. COMMENTS CAN BE SUGGESTIONS TOO. ONLY THEN I WILL KNOW HOW MANY OF U R FOLLOWING THIS BLOG. THANK YOU FOR YOUR TROUBLE.
Subscribe to:
Posts (Atom)