
INTRODUCTION TO TOPOSHEETS-1
Dear student,Welcome to my blog! Many students from all over India have requested to update my blog. So I have decided to update my lessons on toposheets. I'm using very simple language to explain this lesson.
Lets begin.
WHAT IS A MAP?
* Its a pictorial representation of the earth. It is a part
or whole of the earth’s surface.
•It is drawn
to scale, on
a flat sheet of paper

ELEMENTS OF MAP
 A A MAP has 5 elements.
2.Scale
3.Grid
4.Direction
5.Key
1. TITLE
• It Represents
a) Name
of the region depicted
b)Theme
of the map
•Example
–INDIA
(Name of region)
–PHYSICAL
(Theme of the map)
2. SCALE
•Ratio
Ratio is the distance
between two places on map and distance
between same two places on ground
•It can
be expressed as
i) Statement
(2 cm = 1 km OR 2
cm to 1 km)
ii) Representative
Fraction
(1:50000)
Representative Fraction (R.F. ) is also called as numerical scale. It is expressed as a ratio of map distance and ground distance.
For example 1:1,000,000 means one unit of distance on the map corresponds to 1,000,000 units of distance on the ground. The advantage of R.F. is that it can be used universally irrespective of the local unit of measurement of distance. The map can be reduced or enlarged without changing the R.F.
iii. Linear Scale or Graphical Scale:
This scale is expressed as a horizontal or straight line.The base is calibrated to express visual equivalents of representative fraction or verbal scale. The bases are divided into a number of equal parts and are marked to show what these divisions represent on actual ground. The scale has the advantage that it remains true even after reduction or enlargement of the map. However, it is useful only to those who are familiar with the particular unit of measurement.
Understanding Scale
•Scale
Distance between two places
on map (a)
Distance between the same two places on ground (b)
Distance between the same two places on ground (b)

Scale is the relationship between the distance on a map and the real distance on the earth’s surface.
Statement to R.F.
•If
a = 2 cm; b =
1 km
then
•Scale
= 2cm / 1 km
OR
2 cm / 1 X 1000 X 100 cm
OR
1 cm / 50000 cm
OR
1 : 50000
Distances on the map are smaller than the
Distances on the map are smaller than the
corresponding distances on actual ground. Scale is the
means which enables us to reduce the whole or a part
of the earth to a size which is not only convenient and
handy but also logical and scientific. A general
definition of scale is that it is a ratio between the
distance on a map and the corresponding distance on
the earth. For example if two points located 10 km apart
are shown 1 cm apart on a map, then the scale of the
map would be 1 cm to 10 km. It may also be converted
into R.F as given below.Suppose, 1 cm = 10 KM.
MAP DISTANCE
_______________
GROUND DISTANCE
=
1 cm
_____
10 km
=
1 cm
____________
10 X 10,000 cm
= 1: 1,000,000
(Note: 1 km has 100,000 cm.)
_______________
GROUND DISTANCE
=
1 cm
_____
10 km
=
1 cm
____________
10 X 10,000 cm
= 1: 1,000,000
(Note: 1 km has 100,000 cm.)
Methods of Measuring Linear Distance
Linear distance on maps are of two types:
(i) Straight lines like roads, railway line, and canals;
(ii) Curved or Zigzag lines, showing streams, coastline etc.
(a) When the line is straight, the distance can be measured with the help of a divider.Open a pair of dividers and place one of its legs at one end of the straight distance and the other leg on the other end on the map. Then lift the divider and place it on the calibrated bar scale to get the distance on the ground.
(b) When the route is zigzag, place one end of a thread at the starting point and carry the thread along the line. After completing the distance stretch the thread and measure the length. It will give approximate distance.It can also be measured with the help of a plain divider, as explained earlier, but the measurement will be less accurate. It can also be done with the help of a strip of paper.
We covered two points so far. A map has a title and it is drawn to the scale. Check the atlas. Study any map, be it physical, or political.
Did you go through the map? I hope so. Did you find the TITLE and SCALE? I hope you did.
Shall we continue?
3. Grid
GRID: A grid is a rectangular square system of lines superimposed on a map, within which any point can be located.
North / South lines are called Eastings because the numbers increase as they go East.
•East / West lines are called Northings because the numbers increase as they go North.
•East / West lines are called Northings because the numbers increase as they go North.
It is a set of
–Vertical
lines
–Horizontal
lines
* Examples
•Latitudes
& Longitudes
•Northings & Eastings
Grids are used
to locate places
•Draw
an area to proportion on
map
•Could
be used to determine
area

What are Eastings and Northings?
1.Eastings run – move left to right; and
2.Northings run – bottom to top.
What are the two most important things to remember when giving a grid?
1.Easting value first; and
2.never round up.
1.Easting value first; and
2.never round up.
4. Direction


Direction has been defined as an imaginary straight line on the map or the ground showing the angular position of various maps with respect to a common base direction. The line pointing to the north is regarded as the zero direction or base direction line.A map must have the base directions represented on it to enable the user to locate different features with respect to each other. North, south, east and west are the four major directions. These are also called cardinal points. In between cardinal points one may have several intermediate directions.
•Angular
distance
–From
observer’s position
 –To
any place on map
–To
any place on map
–With
respect to NORTH
(Position
of Pole Star)
•Can
be expressed as
–Conventions
(N, S, E, W, etc.)

Bearing OR Azimuth (Angle)


5.Key or Legend

Every map contains a legend or a key. It lists the features and the signs
or symbols used in the map for showing these features. As you know
various types of features or phenomena are represented on maps. They
relate to both land and sea and are shown with the help of conventional
signs and symbols. The signs and symbols include lines, icons, alphabets,
shadings and colours. As a convention, specific colours show certain area
features.
shadings and colours. As a convention, specific colours show certain area
features.

It is a set
of
–Colours
–Symbols
–Shading
patterns
•Used
to depict ground features
on the map
For example: See the Key(Legend) below

Let's revise.
A map has 5 elements. Go through your Atlas.
It has
1.Title 2.Scale 3.Grid 4.Direction 5.Key
Now we will study about Topographical Survey Map.
It has
1.Title 2.Scale 3.Grid 4.Direction 5.Key
Now we will study about Topographical Survey Map.
How is a Topographical Map different?
What is a topographic map?
A topographic map is a detailed and accurate graphic
representation of cultural and natural features on the ground.
 Features of Topographical Maps
 Features of Topographical Maps
•Height
(and it distribution) is
shown using contours
•Helps
one to visualise the pattern
of unevenness
(topography)
of the land
•Large
scale map
–Minute details
are included
–It covers
a smaller area
•It could
be used for a number of purposes
–Millitary
–Building
bridges, roads, railways, dams, canals, etc
–Research
(geology, botany, etc.)
- earth sciences and many other geographic disciplines; mining and other earth-based endeavours;
- and recreational uses such as hiking or, in particular, orienteering, which uses highly detailed maps in its standard requirements.
Showing Topography using hachures + contours

•Map conventions
The various features shown on the map are
represented
by conventional signs or symbols.
For example, colors can be used
to indicate a classification of
roads. These signs are usually explained in the
margin of the
map, or on a separately published characteristic sheet.
•Topographic maps are also commonly called contour maps
or topo maps.
Understanding Topographical Maps
•Understanding of surface depends on the ability to interpret
topo maps.
They-
• are based on accurate surveys.
• show a variety of landforms with carefully chosen symbols
&
signs.
•shows natural features like hills, valleys, waterfalls,
•also show man made features like roads, railways, buildings,
bridges and canals
INTERPRETATIONOF TOPO MAPS AND SURVEY MAPS
•It involves ability to follow the symbols portrayed in the
map.
•Understand the information given in pictorial and written
form
•Visualize the topography of the original area by interpreting
the contour
•Spot heights skillfully
•Map reading is a practical skill.
•Can be developed only by reading topo map very minutely
and mentally analyzing the details with the
help of
conventional signs & symbols given in their conventional
colours
1.Identification of
topographical maps
2.Reading the Grid
reference
3.Scale (R.F.)
4.Representation of
Relief by contours
5.Directions
6.Measuring distances and
calculating distances
7.Drainage
8.Man-made and natural
features
9.Means of transport in
relation to relief
10.Land use and irrigation
11. Settlements
12. Inferring occupations
13. Importance of colours and tints in topographical
survey sheets
14. Legend
15. Glossary of conventional signs and symbols used in
survey
maps
1. INFORMATION IN THE MARGINS
1.Information in the
Margins:
i)The number of the topo sheets: Topo sheets numbers
can give an idea as to which part of India is
shown on the
map.
For example, topo sheet numbers 45D/7, 45D/10 and 45 F/3 show
parts of Gujarat and Rajashthan.
ii) Latitudinal and Longitudinal extent: These indicate in which part of the Earth the area is located.


•Knowing the number of toposheet can give us a clue about
the general physical relief of the
region and its climate which
can be
confirmed by other information given in the map.

•Example
- Since all toposheets are from India, it may be inferred that
all the regions represented by those topo sheets would have
a tropical monsoon
climate, with seasonal rainfall.
•Western Rajasthan – You may expect scanty rainfall- a fact
which could be verified by the presence of dry river beds
and disappearing streams.

45D/7 shows a region of northern Gujarat, closer to the
border of Rajasthan
•45D/10 lies in the southern part of Rajasthan close
to the border of Gujarat region
•45F/3 lies in the western Rajasthan, near Jodhpur
•53B/7 shows a region in Punjab, close to the border
of Haryana.
•64P/13 shows a region in north-east Orissa
Title of Topographical Maps
For example:
•45
D/7
•45
D/10
•67
F/9
 |
| Does it make any sense? |
No??? Didn't get it????
Don't worry! We will do it again!
Bifurcation of Toposheet


i)The number of the topo sheets: Topo sheets numbers can give an idea as
to which part of India is shown on the map.
For example, topo sheet numbers 45D/7, 45D/10 and 45 F/3 show parts of
Gujarat and Rajashthan.


2. READING OF GRID REFERENCE
•A Grid is a set of lines used to find the exact location of places on a map.
•The National Grid Reference is a system of rectangular co-ordinate.
•The origin of the grid reference lies at a point in the south-west corner of the map.
•Thus any place on the map can be located by starting its distance east or north of the origin of the grid reference.
•Topo maps bear the national grid of squares drawn to the scale of 2 cm=1km with each square having a side measuring 1 km.
•These are sheets most commonly used for various purposes and are of vital practical importance.
•Vertical lines=Eastings since they are numbered from west to East
•Horizontal lines = Northings - they are numbered from South to North
•Net work of horizontal and vertical lines or the Eastings and Northings , is called the Grid.
 |
| Confused? Too much of theory? |
Let's do it again!
See the picture below.
GRID REFERENCE

1. Relative Location

§Location expressed using landmarks
▪Behind
Big Bazaar
▪Opposite
Shiv Temple
▪Near
Patel Pan
2.Absolute Location
§Location expressed using known
grid
system
▪19°
N; 78° E
GRID SYSTEM USED IN TOPOGRAPHICAL MAPS
1. Latitudes and longitudes
2. Eastings and Northings

•A Grid is a set of lines used to find the exact
location of
places on a map.
•The National Grid Reference is a system of
rectangular
co-ordinate.
•The origin of the grid reference lies at a point
in the
south-west corner of the map.
•Thus any place on the map can be located by
starting its
distance east or north of the origin
of the grid reference.
 |
| See Eastings and Northings in this map |
Topo maps
bear the national grid of squares drawn
to the
scale of 2 cm=1km with each square having a side
measuring 1 km.
•These are sheets most commonly used for
various purposes
and are of vital practical importance.
•Vertical lines=Eastings since they are numbered
from west
to East
•Horizontal lines = Northings -
they are numbered from
South to North
•Net work of horizontal and vertical lines or
the Eastings and
Northings , is called the Grid.
•It is also identified as the Grid Reference.

READING THE GRID REFERENCE
i)Origin is the South –West (SW) corner of the map. The reading on the map is always taken with reference to this origin.
ii)Eastings are always read to the East of the origin.
iii)Northings are always read to the North of the origin.
•It is also identified as the Grid Reference
i)The readings are always taken to the right of the Eastings and to the North of the Northings.
ii)While giving a grid reference, Eastings are always stated first, followed by Northings
i)Origin is the South –West (SW) corner of the map. The reading on the map is always taken with reference to this origin.
ii)Eastings are always read to the East of the origin.
iii)Northings are always read to the North of the origin.
•It is also identified as the Grid Reference
ii)While giving a grid reference, Eastings are always stated first, followed by Northings
4 FIGURE GRID REFERENCE
In four-figure grid reference, the first two figures are the
eastings and the last two are the northings
So remember, in Four Figure Grid Reference
¡First two digits are eastings
¡Next two digits are northings
¡By convention, lesser value is always taken


How did we get the 4 figuure grid reference?
Check the map below.
1) Find the Four Figure Grid Reference of RAMPURA.
First, locate Rampura. See RED SETTLEMENTS
Move from West to East.
Rampura settlements begins after the Easting 95
So Easting is 95
Then move from South to North (Northings)
Rampura Settlement begins just after Northing 80
So Northing is 80
So 4 Figure grid reference of Rampura is 9580
2) Find the Four Figure Grid Reference of ARNWADA.
First, locate ARNWADA. See RED SETTLEMENTS
Move from West to East.
Arnwada settlements begins after the Easting 94
So Easting is 94
Then move from South to North (Northings)
Arnwada Settlement begins just after Northing 81
So Northing is 80
So 4 Figure grid reference of Arnwada is 9481

Few examples to make you clear!


SMALL TEST


Did you cheat?

Now check your answers!

Did you get all the answers right? Yes? Did you cheat?

Ok, Don't scream at me! I believe you.
Let me check again! Do this work sheet

Let me check again! Do this work sheet

Write your answers in the comment!
SIX FIGURE GRID REFERENCE
Four figure grid references are indeed very useful. However, a major
weakness of four figure grid references is the fact that they are not very
accurate. All objects in the same grid square have the same four figure
grid reference even though they may be hundreds of meters apart . When
greater accuracy is necessary, a six figure grid reference is used. A six
figure grid reference does not only indicate the grid square an object is
located in, it also tells us the exact point within the grid square where the
object is found. Therefore, objects located in the same grid square will
have the same four figure grid reference, but different six figure grid
references.
How to Give a Six Figure Grid Reference?
EE represents Easting, NN represents Northings.
A six figure grid reference takes the form EEXNNY. EE and NN represent
four figure grid reference for the object in question. X is a digit which tells
us how close to or far away from the easting the object is located. The
higher the number, the farther away from the easting the object is.
Similarly, Y is a digit which tells us how close to or far away from
the northing the object is found. X and Y can have a value ranging from
zero to nine.
So remember:
For greater accuracy, a third figure may be
added to
two-figure eastings and northings.
i) Obtain
the four figure reference by using first
two digits of eastings and northings.
ii) Then divide each kilometre into ten parts visually, both
vertically & horizontally.
iii) Mark the division of eastings and
the division of the northing corresponding to the location.
iv) The crossing point is the location of the
reference point
Look at the grid square below. Look at the letter “A” located
within the square. The four figure grid reference for “A” is 2345.
However, 2345 is also the four figure grid reference for any object
which lies anywhere in this grid square. We can give the exact
location of this “A” by giving a six figure grid reference. Let us take it
step by step.

Step 1
Remember a six figure grid reference takes the form EEXNNY. The first two digits represent the easting immediately to the left of the object. The easting to the left of “A” is 23, therefore we have our first two digits. The third digit (X) represents the distance between easting 23 and “A”. To determine this we need to divide the space between easting 23 and easting 24 into ten equal parts as seen in the diagram below.

The lines are parallel to our easting are an equal distance apart from each other. Let’s call these lines “mini eastings”. Now we need to count the number of mini eastings that are between easting 23 and “A”. In this case there are four. Therefore our third digit is 4. So the first part of our six figure grid reference is 234.
Step 2
The fourth and fifth digits in a six figure grid reference represent the northing which is directly under the object. In this case it is northing 45. The sixth digit tells us the distance between northing 45 and the object. We must divide the space between northings 45 and 46 into ten equal parts as seen below.

Once again the lines are parallel to northing 45 and are an equal distance apart. Let us call these lines “mini northings”. We must count the number of mini northings which are between northing 45 and “A”. In this case there are seven of them. Therefore 7 will be the last digit in our six figure grid reference. The second part of our grid reference is 457.
Our entire six figure grid reference is 234457. Remember:
- the first two digits represent the easting immediately to the left of the object( in this case easting 23).
- the third digit (4) represents the distance between the easting and our object. In this case the object is roughly four tenths of the distance between easting 23 and easting 24.
- the fourth and fifth digits represent the northing directly under our object (in this case northing 45)
- the sixth digit represents the distance between the northing and our object. In this case, the object is roughly seven tenths of the distance between northing 45 and northing 46.
Note: If the position of “A” was such that it lay directly on mini easting 4 or mini northing 7, its six figure grid reference would still be 234457.
The two steps shown above need not be done separately. Your “mini eastings” and “mini northings” can be drawn such that they form a smaller grid inside the grid square in which the object is located. The six figure grid reference can be completed by giving the number of the mini easting immediately to the left of the object and the number of the mini easting directly under it (see below).

The six figure grid reference is 234457


Find the six figure grid reference of temple


3. SCALE
Dear friend,
We have already done with SCALE. Let's do it again.
Refer to Survey Map No. 45D/7
•In the map, 1:50,000 is the R.F. of the map, which means that one unit on the map represents 50,000 units on the ground.
•For example, 1 cm on the map represents 50,000 cm on the ground.
•In the map, 1:50,000 is the R.F. of the map, which means that one unit on the map represents 50,000 units on the ground.
•For example, 1 cm on the map represents 50,000 cm on the ground.

(Scale of this toposheet is)
Scale-2cm:1 km or 1:50,000
Scale-2cm:1 km or 1:50,000
Scale is a RATIO
Distance between two places on map (a)
Distance
between the same two places on ground (b)
•It can be expressed as1.Statement
(2 cm = 1 km OR 2 cm to 1 km)2.Representative
Fraction (1:50000)3.Linear
Scale
Statement
to R.F.
•If a = 2 cm; b = 1 km
•Scale = 2cm / 1 km
OR
2
cm / 1 X 1000 X 100 cm
OR
1
cm / 50000 cm
OR
1 : 50000
R.F. or Representative Fraction is the ratio between the distance on the map and the corresponding distance on the ground in the same unit.
•Therefore, R.F.
Distance on the map
___________________
Distance on the groundIn the above map, R.F. = 1:50,000
This map is referred to as 1:50,000 map and its scale is 2 cm=1 km.
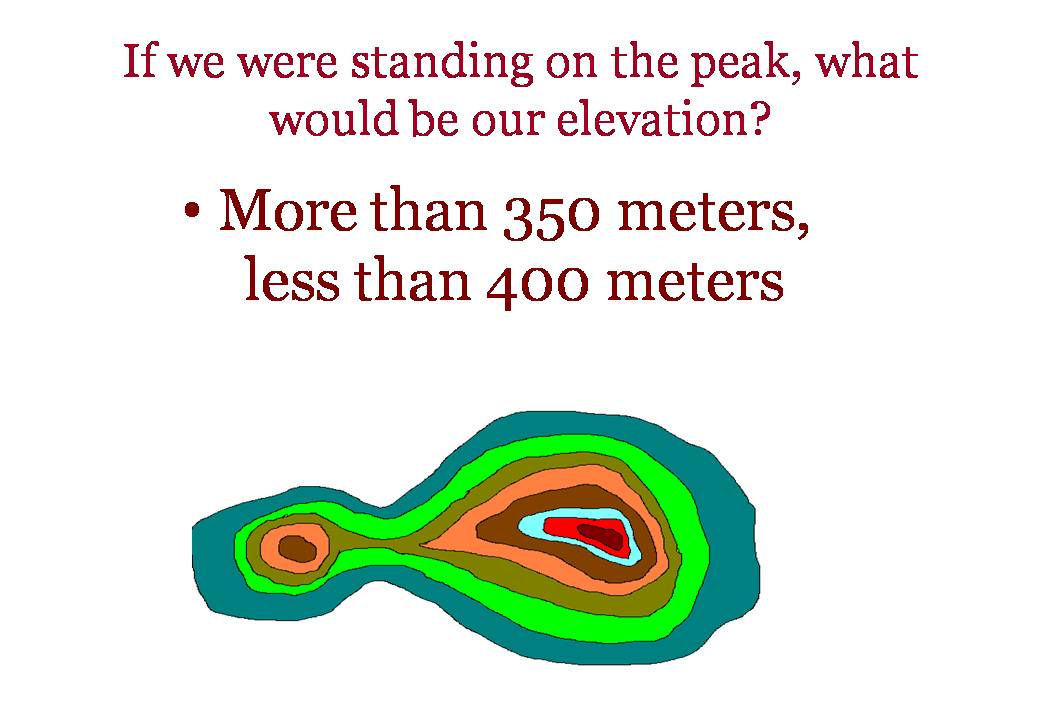
4.Representation of Relief by contours
CONTOURS

What are contours?


•A contour is a line on a map joining two points of equal height, and is the standard method of showing relief on a topographical map.
CONTOUR INTERVAL: The difference of elevation between two successive contours. Contour interval on the toposheet is 20 meters
Please Note:
Contours are shown at regular vertical intervals.
- On a 1:50,000 map the interval is 20 m.


Characteristics of Contours
•All places on the
contour line lie at the same elevation
•Contours never
intersect each other
•Contour interval
(difference between two successive
contour values) is uniform throughout the
map
•All contour values
are multiples of the contour interval
•Height of any place
on map can be determined
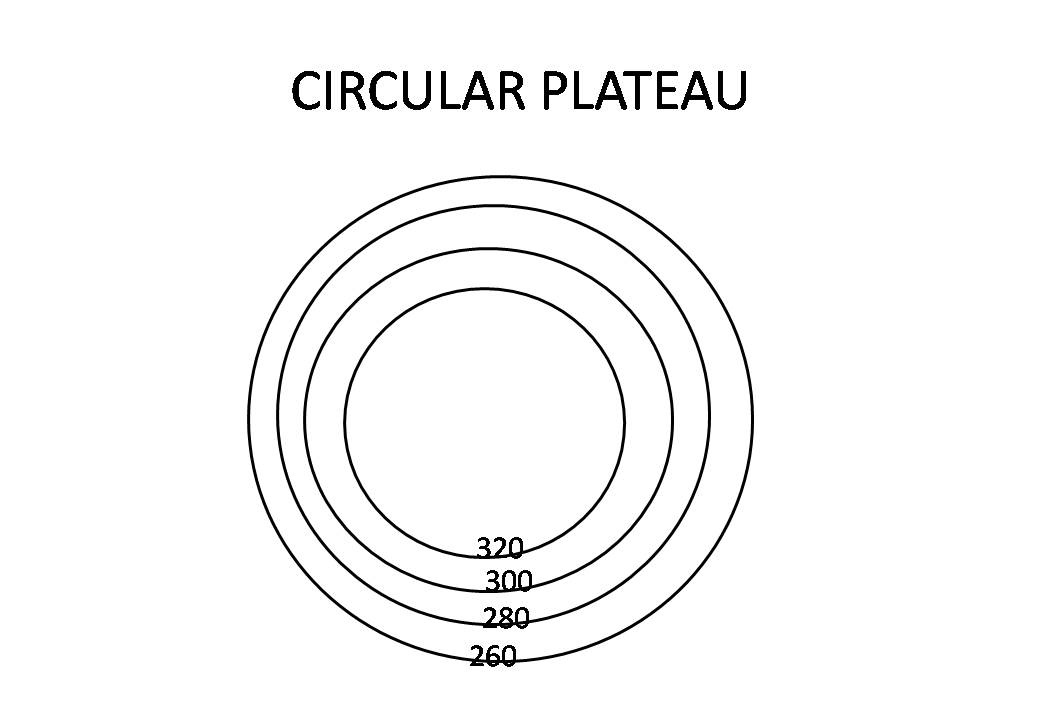
Spacing between contours
•Widely spaced
contours –Gentle slope
•Closely packed
contours –Steep slope
•Overlapping contours –Vertical slope


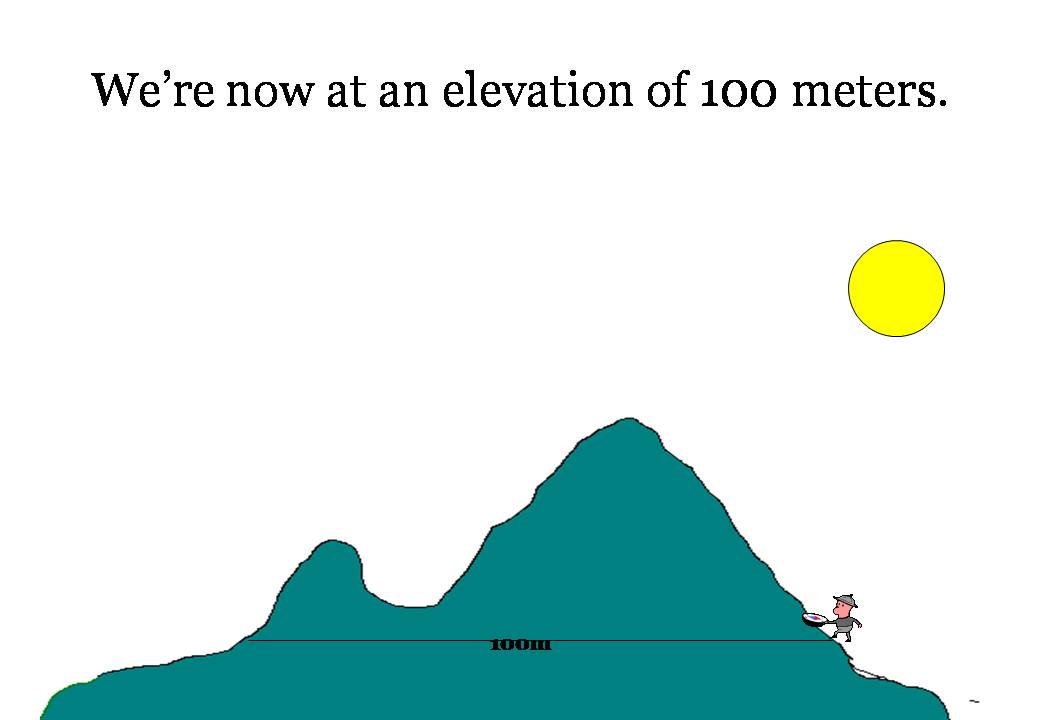


Visualisation


INTERPRETATION OF CONTOURS
•The shape of the contours indicates the shape of the ground.
When contours are further apart, the slope is gentle and when contours are close together the greater the drop.
When contours are equal distance apart, the slope is uniform:
a.Contours are continuous. No matter how far they travel, they always return to where they started. Except for a cliff.
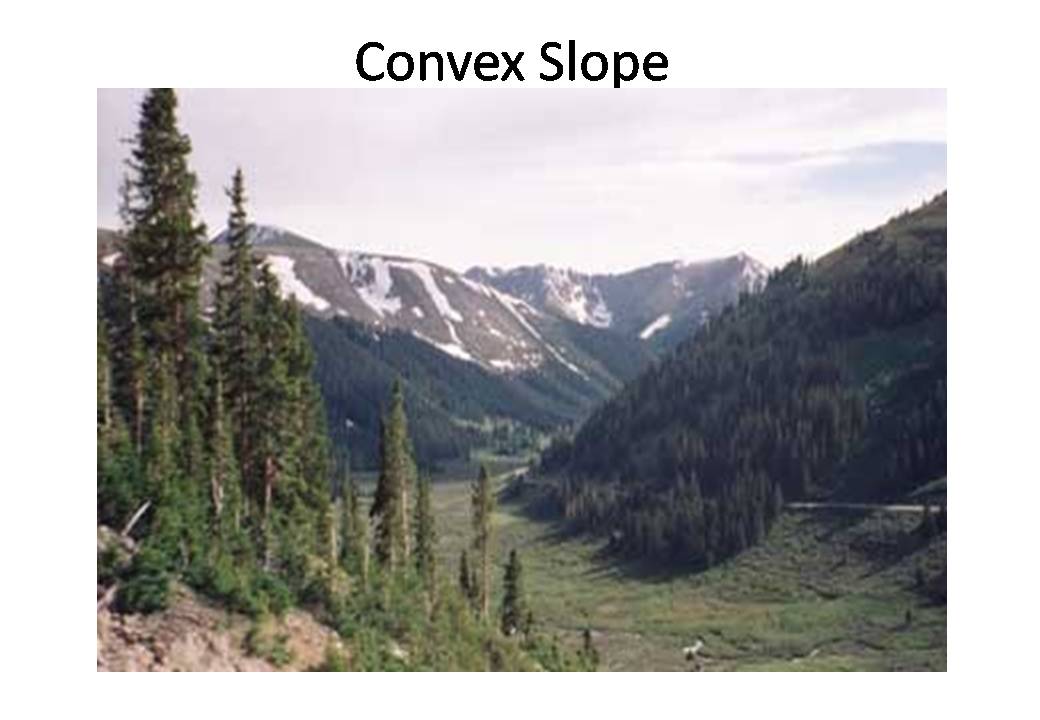
b.When spacing of contours down a slope gets close together at the bottom, the slope is convex.
c. When spacing is further apart, the slope is concave.
Please Note: This lesson will be updated again.
Do you find the blog useful? Write your comments! Do share your notes, images, pictures so that I can update the lesson and blog.
Br. Hector Pinto
St. Joseph's College, Nainital
For detailed explanation, click this link:
No comments:
Post a Comment